ショート
Ger30 Short
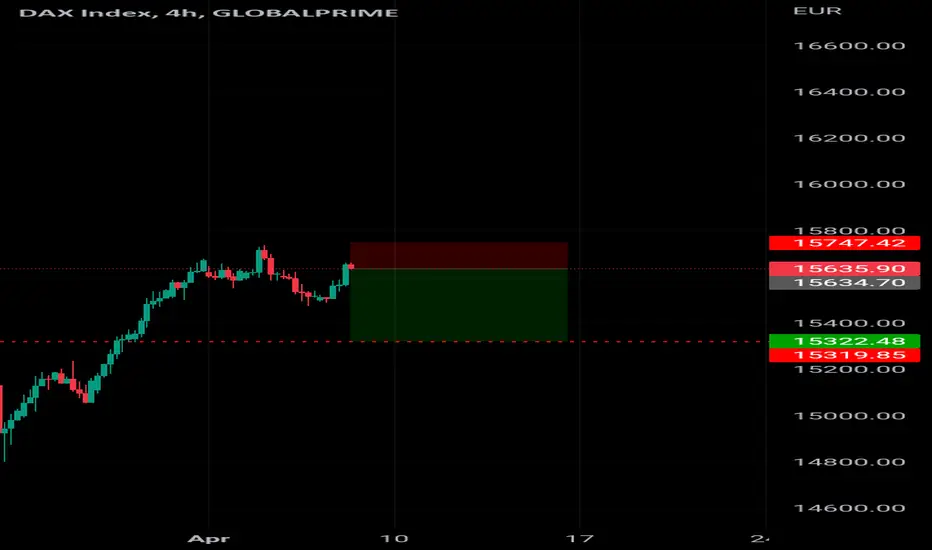
Ger30 Short potential
Short it now
The GER30 daily chart is trading in its bullish channel between its upper blue and red bands. It RSI is trading above 50 (green rectangle). The longer it maintains on the bullish side of 50 the greater the probability of higher prices ahead.
The hourly chart shows a strong start to today's trade. The trend following EMAs and the momentum-based stochastic have turned up (black ellipses). If the stochastic makes its way to the 80+ levels (blue arrow) and holds it will denote a strong underlying bullish momentum is present.

免責事項
これらの情報および投稿は、TradingViewが提供または承認する金融、投資、取引、またはその他の種類の助言もしくは推奨であることを意図したものではなく、またこれらに該当するものでもありません。詳細は利用規約をご覧ください。
免責事項
これらの情報および投稿は、TradingViewが提供または承認する金融、投資、取引、またはその他の種類の助言もしくは推奨であることを意図したものではなく、またこれらに該当するものでもありません。詳細は利用規約をご覧ください。