ロング
$GLCH long term view
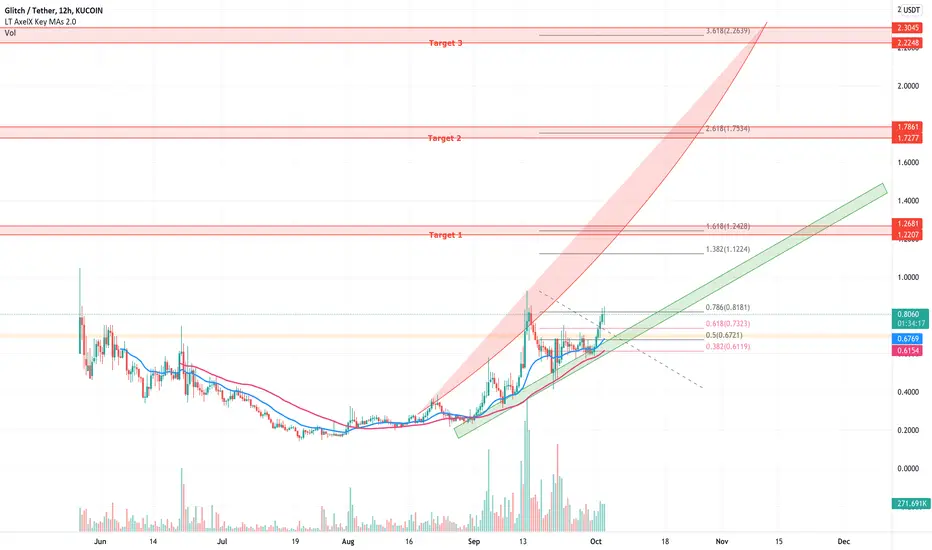
In this chart I show my expectations for $GLCH based on fib level and oversold/ overbought zones.
Red curve = overbought, we see a retranchement every time we get into this zone.
Green curve = accumulation, we get a pump every time we reach this zone.
First target around $1.25.
Target 2: $1.75
Target 3: $2.25
This chart will be updated once we go further in the cycle.
Red curve = overbought, we see a retranchement every time we get into this zone.
Green curve = accumulation, we get a pump every time we reach this zone.
First target around $1.25.
Target 2: $1.75
Target 3: $2.25
This chart will be updated once we go further in the cycle.

免責事項
これらの情報および投稿は、TradingViewが提供または承認する金融、投資、取引、またはその他の種類の助言もしくは推奨であることを意図したものではなく、またこれらに該当するものでもありません。詳細は利用規約をご覧ください。
免責事項
これらの情報および投稿は、TradingViewが提供または承認する金融、投資、取引、またはその他の種類の助言もしくは推奨であることを意図したものではなく、またこれらに該当するものでもありません。詳細は利用規約をご覧ください。