$GLCH projection based on the LOG chart
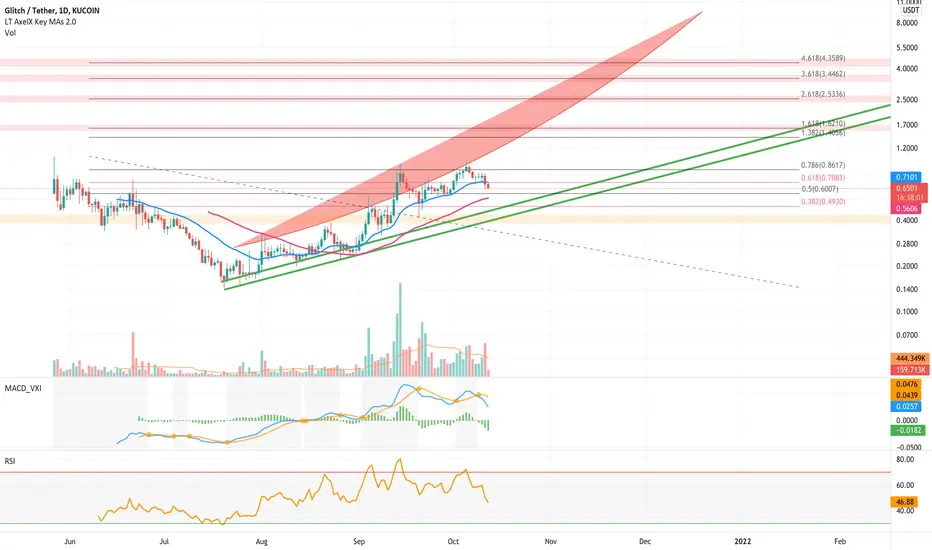
My previous model on GGCH is broken, this model only looked at linear data. Since most of the moves in crypto are exponential most of the times. It could be better to take the LOG chart in consideration...
In this chart potential upside and downside is greater.
The support band of the LOG chart shows a potential bottom between $0.47 - $0.40.
In this chart potential upside and downside is greater.
The support band of the LOG chart shows a potential bottom between $0.47 - $0.40.

免責事項
これらの情報および投稿は、TradingViewが提供または承認する金融、投資、取引、またはその他の種類の助言もしくは推奨であることを意図したものではなく、またこれらに該当するものでもありません。詳細は利用規約をご覧ください。
免責事項
これらの情報および投稿は、TradingViewが提供または承認する金融、投資、取引、またはその他の種類の助言もしくは推奨であることを意図したものではなく、またこれらに該当するものでもありません。詳細は利用規約をご覧ください。