
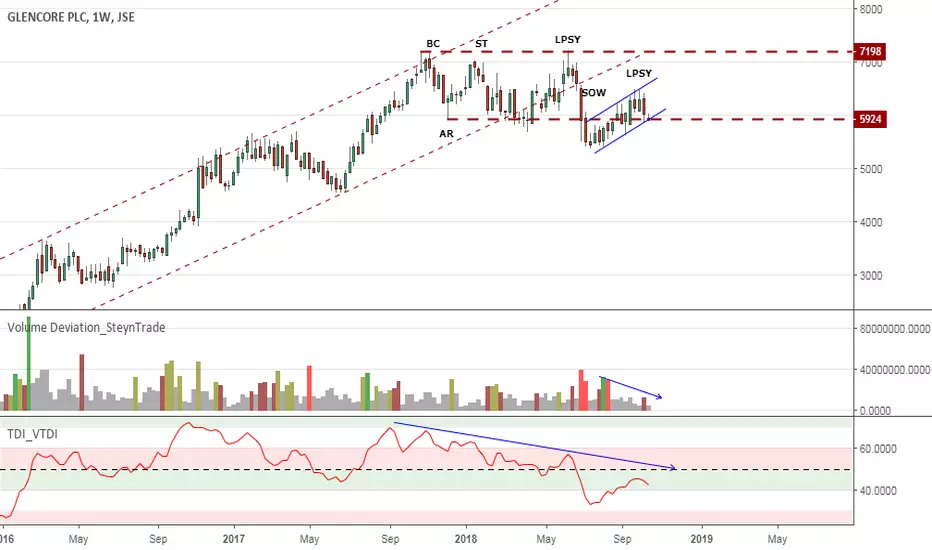
Glencore has broken the upward stride that was in place since 2016. After breaking the stride there was a decline on volume and wide spread bars indicating Signs of Weakness (SOW). The subsequent rally bars has smaller spread with declining volume indicating the demand has dried up and the distribution is nearly complete. Once the trend line for the current correction is broken the markdown could start. The Volume RSI also indicates weakness with volumes on green bars being lower than for red bars.
ノート
The markdown seems to have started with a break of the bear flag.ノート
GLN continues to be week.ノート
The weakness continues. ノート
The distribution continues.
免責事項
これらの情報および投稿は、TradingViewが提供または承認する金融、投資、取引、またはその他の種類の助言もしくは推奨であることを意図したものではなく、またこれらに該当するものでもありません。詳細は利用規約をご覧ください。
免責事項
これらの情報および投稿は、TradingViewが提供または承認する金融、投資、取引、またはその他の種類の助言もしくは推奨であることを意図したものではなく、またこれらに該当するものでもありません。詳細は利用規約をご覧ください。