
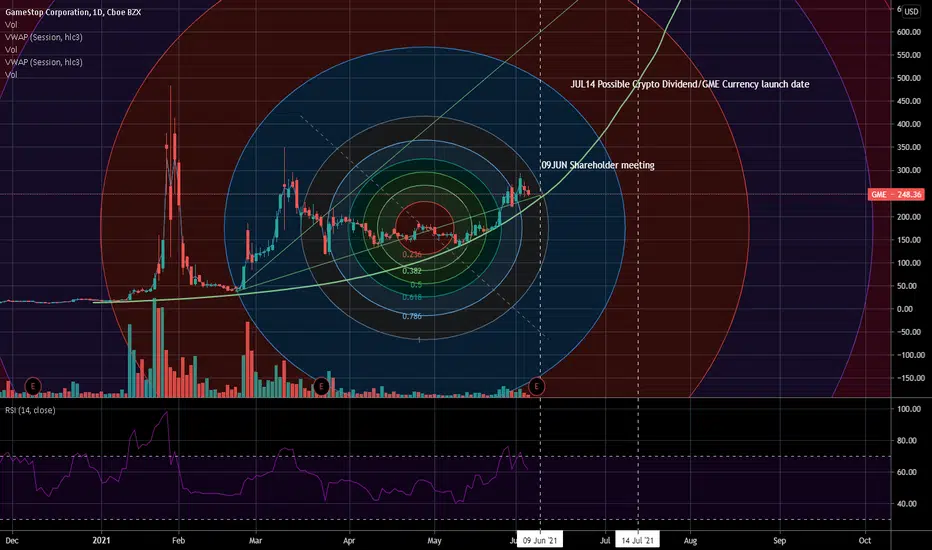
Fib retracement levels are matching perfectly with a price floor trend line drawn on the logarithmic chart. Intra-day Technical Analysis is voodoo at best on GME, but the daily chart shows undeniable patterns drawn over the longer term. My last prediction about Wyckoff accumulation was spot on, and I believe this Fibonacci circles also show GME's potential due to the myriad of factors surrounding the GameStop short squeeze. Volume has entirely dried up in comparison to earlier this year. High-frequency algorithmic trading of Rehypothecated shares, alongside retail "hodling" pressure show that "just up" is an accurate statement in regards to GME.
ノート
Unfortunately, this didn't pan out - There is another fib circle retracement line coming up soon around November. Possibly see movement around there.
免責事項
これらの情報および投稿は、TradingViewが提供または承認する金融、投資、取引、またはその他の種類の助言もしくは推奨であることを意図したものではなく、またこれらに該当するものでもありません。詳細は利用規約をご覧ください。
免責事項
これらの情報および投稿は、TradingViewが提供または承認する金融、投資、取引、またはその他の種類の助言もしくは推奨であることを意図したものではなく、またこれらに該当するものでもありません。詳細は利用規約をご覧ください。