
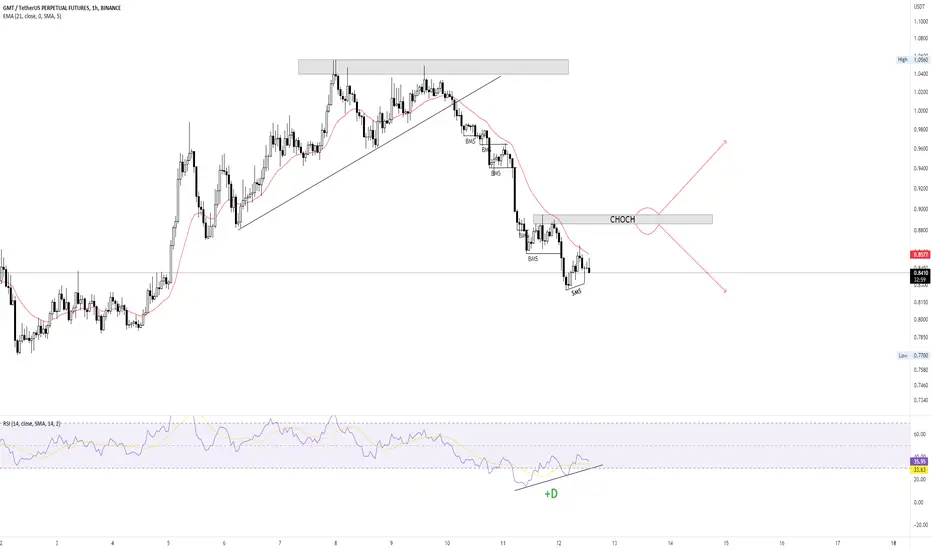
As observed on the chart, GMTUSDT on the hourly timeframe has a bullish RSI divergence and it is simultaneously showing weakness in its bearish trend. Its price is highly likely to move up until its CHOCH zone.
Once price taps this zone it would probably continue its bearish trend and give us an entry for a short position. However if the CHOCH zone is broken, price could reverse its trend and continue the bullish movement.
Once price taps this zone it would probably continue its bearish trend and give us an entry for a short position. However if the CHOCH zone is broken, price could reverse its trend and continue the bullish movement.
トレード終了: 利益確定目標に到達
トレード終了: 利益確定目標に到達

免責事項
これらの情報および投稿は、TradingViewが提供または承認する金融、投資、取引、またはその他の種類の助言もしくは推奨であることを意図したものではなく、またこれらに該当するものでもありません。詳細は利用規約をご覧ください。
免責事項
これらの情報および投稿は、TradingViewが提供または承認する金融、投資、取引、またはその他の種類の助言もしくは推奨であることを意図したものではなく、またこれらに該当するものでもありません。詳細は利用規約をご覧ください。