
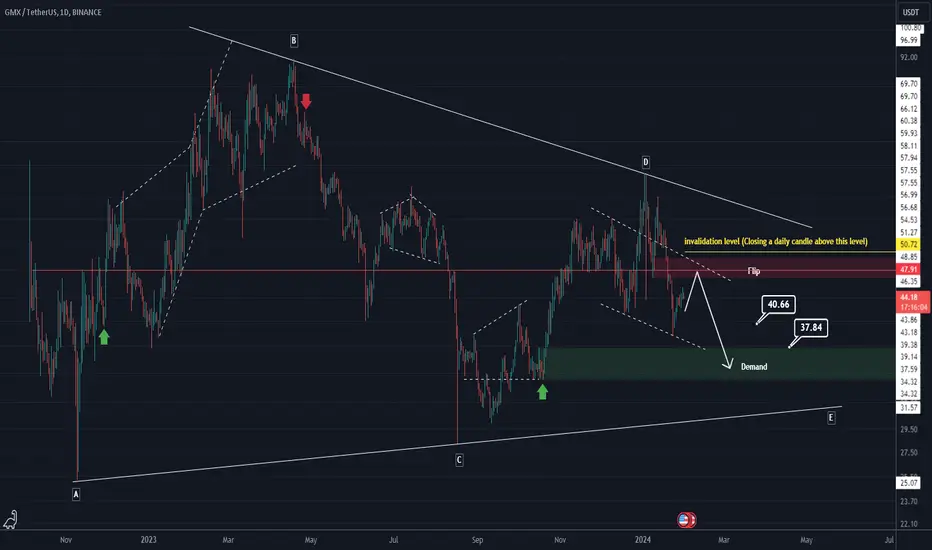
According to the wave count of the GMX chart, we can consider a triangle or diametric scenario for this coin.
We now seem to be in wave e of D.
Whichever of these scenarios is going on, the red flip range is the range where we are looking for sell/short positions.
We marked the targets on the picture. We also specified the invalidation level, closing a daily candle above this level will violate the analysis.
For risk management, please don't forget stop loss and capital management
When we reach the first target, save some profit and then change the stop to entry
Comment if you have any questions
Thank You
We now seem to be in wave e of D.
Whichever of these scenarios is going on, the red flip range is the range where we are looking for sell/short positions.
We marked the targets on the picture. We also specified the invalidation level, closing a daily candle above this level will violate the analysis.
For risk management, please don't forget stop loss and capital management
When we reach the first target, save some profit and then change the stop to entry
Comment if you have any questions
Thank You

✅ Join our Telegram channel to succeed in crypto trading.
💎Our CRYPTO Telegram Channel: 👉 t.me/Behdark_EN
💎Our FOREX Telegram Channel: 👉 t.me/FX_Behdark
💎Our CRYPTO Telegram Channel: 👉 t.me/Behdark_EN
💎Our FOREX Telegram Channel: 👉 t.me/FX_Behdark
免責事項
これらの情報および投稿は、TradingViewが提供または承認する金融、投資、取引、またはその他の種類の助言もしくは推奨であることを意図したものではなく、またこれらに該当するものでもありません。詳細は利用規約をご覧ください。
✅ Join our Telegram channel to succeed in crypto trading.
💎Our CRYPTO Telegram Channel: 👉 t.me/Behdark_EN
💎Our FOREX Telegram Channel: 👉 t.me/FX_Behdark
💎Our CRYPTO Telegram Channel: 👉 t.me/Behdark_EN
💎Our FOREX Telegram Channel: 👉 t.me/FX_Behdark
免責事項
これらの情報および投稿は、TradingViewが提供または承認する金融、投資、取引、またはその他の種類の助言もしくは推奨であることを意図したものではなく、またこれらに該当するものでもありません。詳細は利用規約をご覧ください。