アップデート済
Golem Trend Change
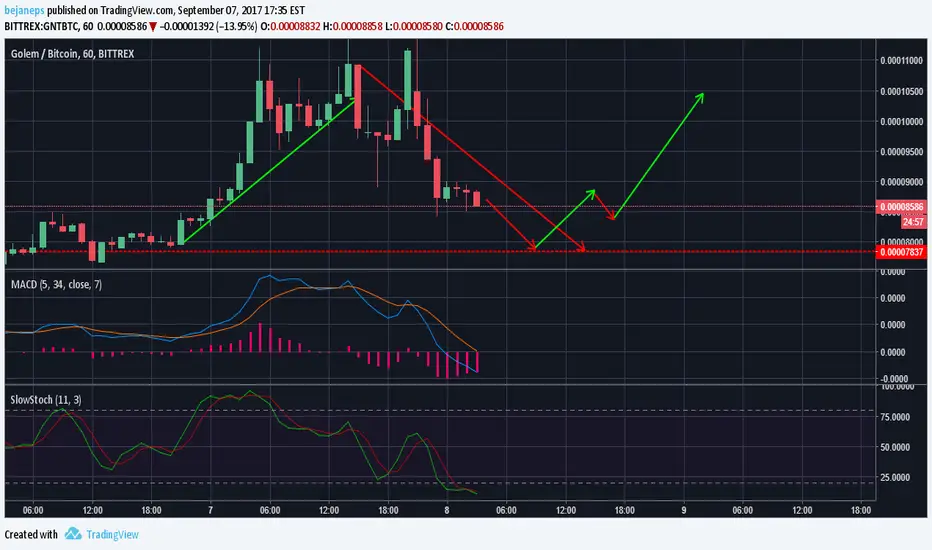
General: approximately in 4-12 hours we can capture trend change. Price will go down till support line or a bit higher than support. Waiting for MACD Indicator to change DMI+ and DMI- lines.
Indicators: MACD showing that histogram is getting weaker and distance between DMI+ and DMI+ is decreasing. By looking at Slow Stochastic we can observe that fast line is jumping from lower limit.
Profit: Take profit on 10%-20% and put your stop-limits at support line.
Good luck and take care !
Indicators: MACD showing that histogram is getting weaker and distance between DMI+ and DMI+ is decreasing. By looking at Slow Stochastic we can observe that fast line is jumping from lower limit.
Profit: Take profit on 10%-20% and put your stop-limits at support line.
Good luck and take care !
トレード稼働中
Waiting for trend change, keep your coins.手動でトレードを終了しました
Bad qualified conference from Golem team, price effected greatly.
免責事項
これらの情報および投稿は、TradingViewが提供または承認する金融、投資、取引、またはその他の種類の助言もしくは推奨であることを意図したものではなく、またこれらに該当するものでもありません。詳細は利用規約をご覧ください。
免責事項
これらの情報および投稿は、TradingViewが提供または承認する金融、投資、取引、またはその他の種類の助言もしくは推奨であることを意図したものではなく、またこれらに該当するものでもありません。詳細は利用規約をご覧ください。