GOBTC Chart Analysis
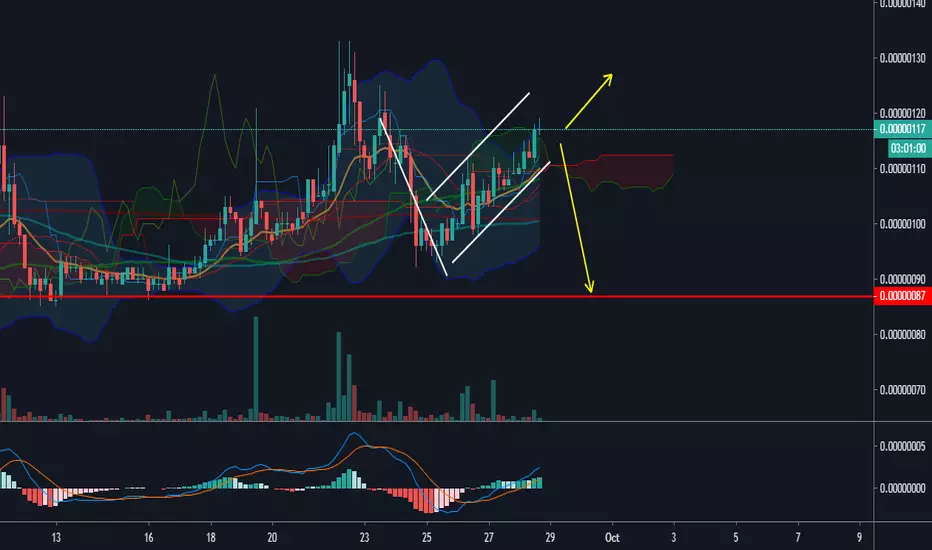
It is possible that, after a little rise, it will fall back to the support line.
Another possibility is that from the next candle, without rising, reach to the same line.
The flag pattern and the reduction of the volume of transactions in the chart are clear.
Another possibility is that from the next candle, without rising, reach to the same line.
The flag pattern and the reduction of the volume of transactions in the chart are clear.

免責事項
これらの情報および投稿は、TradingViewが提供または承認する金融、投資、取引、またはその他の種類の助言もしくは推奨であることを意図したものではなく、またこれらに該当するものでもありません。詳細は利用規約をご覧ください。
免責事項
これらの情報および投稿は、TradingViewが提供または承認する金融、投資、取引、またはその他の種類の助言もしくは推奨であることを意図したものではなく、またこれらに該当するものでもありません。詳細は利用規約をご覧ください。