
Generated: 2026-03-27 03:42 ET
Gold: Multi-Timeframe Bear Case Builds 🔻 | Bounce Window Opens Briefly
Gold has experienced one of its sharpest monthly declines in years — down roughly 21% from the January 2026 high of $5,626.80 — and the weight of evidence across all three timeframes continues to tilt bearish. However, short-term timing models are flagging a high-probability bounce window that traders should not ignore.
📅 Daily: A Bounce Is Likely Underway — But It Has a Ceiling
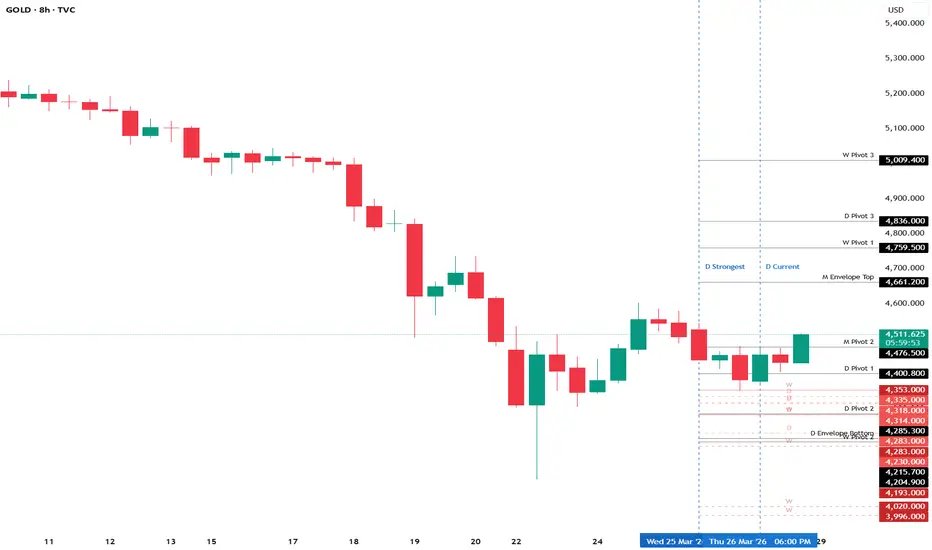
The daily timing array identified March 26 as its strongest turning point, with March 27 flagged as a Directional Change session. The array language suggests the opposite trend was implied into Friday — and indeed, gold has already moved sharply off the March 26 low near 4,348–4,376, with price probing the 4,450–4,470 zone.
This short-term bounce setup is supported by a key technical divergence: while price made new intraday lows, momentum models continued to make higher highs — a classic signal that any correction may hold underlying support rather than representing a true trend change at this level.
Daily stochastics remain deeply oversold, and a Fibonacci time convergence of exceptional strength (13 independent measurements) clusters around March 28 — meaning the bounce window may extend slightly into the weekend open before resolving.
The upside target for this move leans toward the 4,534–4,574 zone, where a cluster of daily projected resistance levels and Fibonacci retracements converge. A sustained move back below 4,369 would suggest the bounce has failed.
⚠️ This is viewed as a counter-trend bounce within a larger bearish structure — not a reversal.
📆 Weekly: Structural Breakdown in Progress — March 30 Target Ahead
The weekly picture leans clearly bearish. The timing array flags the week of March 30 as a potential low — but the key condition (penetrating the March 16 intraday low) has already been met, increasing the probability this level acts as a temporary pause rather than a meaningful floor.
The critical level to watch is 4,353 — the first Major Weekly Bearish Reversal. A weekly close below this level would, based on historical pattern analysis, open the path toward 4,283 and then 4,193. The intraday low of 4,348 has already breached it, meaning election risk is elevated.
Weekly stochastics are executing a confirmed bearish cross from historically overbought levels, with substantial room before reaching oversold. Energy models delivered a peak-coincident top warning at the March 2 high and continue to decline alongside price.
Looking further out, June 1 is flagged as the strongest weekly timing target, with a Panic Cycle window around May 11 — both warrant close attention.
📈 Monthly: Post-Parabolic Exhaustion — Long Road Down Possible
The monthly timeframe confirms the broader macro setup has shifted. The January 2026 high at $5,626.80 coincided with an extreme energy peak — the clearest possible major top signal on this timeframe. Monthly stochastics are rolling over from overbought extremes (red ~84), with enormous room before any oversold condition emerges.
No monthly Bearish Reversals have been elected yet — the first sits at $3,841. A monthly close below that level would be a formal structural confirmation and could significantly accelerate selling pressure. Until then, conditions suggest a sustained correction rather than a confirmed crash.
Monthly timing models point to April as a near-term turning point</b> and August as the strongest annual target</b>, with an October Panic Cycle window. The Global Market Watch at the monthly level flags a "possible waterfall to downside" scenario — which, combined with a yearly "possible major high" reading, increases the probability that this correction has months, not days, to run.
🔑 Key Levels to Watch
- Short-term bounce resistance: 4,534–4,574
- Critical weekly trigger: 4,353 (election = bearish cascade risk)
- First monthly support floor: 3,841
- Invalidation of bearish view: sustained monthly close above 4,882+
Bottom Line: The multi-timeframe setup leans strongly toward continued downside pressure over the coming weeks and months. A near-term bounce toward 4,534–4,574 is a higher-probability short-term event, but the structural evidence suggests any strength is likely to be sold. The next major timing windows — March 30, June 1, and August — will be critical tests of whether this correction deepens into a more significant macro decline. 🐻
Gold: Multi-Timeframe Bear Case Builds 🔻 | Bounce Window Opens Briefly
Gold has experienced one of its sharpest monthly declines in years — down roughly 21% from the January 2026 high of $5,626.80 — and the weight of evidence across all three timeframes continues to tilt bearish. However, short-term timing models are flagging a high-probability bounce window that traders should not ignore.
📅 Daily: A Bounce Is Likely Underway — But It Has a Ceiling
The daily timing array identified March 26 as its strongest turning point, with March 27 flagged as a Directional Change session. The array language suggests the opposite trend was implied into Friday — and indeed, gold has already moved sharply off the March 26 low near 4,348–4,376, with price probing the 4,450–4,470 zone.
This short-term bounce setup is supported by a key technical divergence: while price made new intraday lows, momentum models continued to make higher highs — a classic signal that any correction may hold underlying support rather than representing a true trend change at this level.
Daily stochastics remain deeply oversold, and a Fibonacci time convergence of exceptional strength (13 independent measurements) clusters around March 28 — meaning the bounce window may extend slightly into the weekend open before resolving.
The upside target for this move leans toward the 4,534–4,574 zone, where a cluster of daily projected resistance levels and Fibonacci retracements converge. A sustained move back below 4,369 would suggest the bounce has failed.
⚠️ This is viewed as a counter-trend bounce within a larger bearish structure — not a reversal.
📆 Weekly: Structural Breakdown in Progress — March 30 Target Ahead
The weekly picture leans clearly bearish. The timing array flags the week of March 30 as a potential low — but the key condition (penetrating the March 16 intraday low) has already been met, increasing the probability this level acts as a temporary pause rather than a meaningful floor.
The critical level to watch is 4,353 — the first Major Weekly Bearish Reversal. A weekly close below this level would, based on historical pattern analysis, open the path toward 4,283 and then 4,193. The intraday low of 4,348 has already breached it, meaning election risk is elevated.
Weekly stochastics are executing a confirmed bearish cross from historically overbought levels, with substantial room before reaching oversold. Energy models delivered a peak-coincident top warning at the March 2 high and continue to decline alongside price.
Looking further out, June 1 is flagged as the strongest weekly timing target, with a Panic Cycle window around May 11 — both warrant close attention.
📈 Monthly: Post-Parabolic Exhaustion — Long Road Down Possible
The monthly timeframe confirms the broader macro setup has shifted. The January 2026 high at $5,626.80 coincided with an extreme energy peak — the clearest possible major top signal on this timeframe. Monthly stochastics are rolling over from overbought extremes (red ~84), with enormous room before any oversold condition emerges.
No monthly Bearish Reversals have been elected yet — the first sits at $3,841. A monthly close below that level would be a formal structural confirmation and could significantly accelerate selling pressure. Until then, conditions suggest a sustained correction rather than a confirmed crash.
Monthly timing models point to April as a near-term turning point</b> and August as the strongest annual target</b>, with an October Panic Cycle window. The Global Market Watch at the monthly level flags a "possible waterfall to downside" scenario — which, combined with a yearly "possible major high" reading, increases the probability that this correction has months, not days, to run.
🔑 Key Levels to Watch
- Short-term bounce resistance: 4,534–4,574
- Critical weekly trigger: 4,353 (election = bearish cascade risk)
- First monthly support floor: 3,841
- Invalidation of bearish view: sustained monthly close above 4,882+
Bottom Line: The multi-timeframe setup leans strongly toward continued downside pressure over the coming weeks and months. A near-term bounce toward 4,534–4,574 is a higher-probability short-term event, but the structural evidence suggests any strength is likely to be sold. The next major timing windows — March 30, June 1, and August — will be critical tests of whether this correction deepens into a more significant macro decline. 🐻

免責事項
これらの情報および投稿は、TradingViewが提供または承認する金融、投資、取引、またはその他の種類の助言もしくは推奨であることを意図したものではなく、またこれらに該当するものでもありません。詳細は利用規約をご覧ください。
免責事項
これらの情報および投稿は、TradingViewが提供または承認する金融、投資、取引、またはその他の種類の助言もしくは推奨であることを意図したものではなく、またこれらに該当するものでもありません。詳細は利用規約をご覧ください。