
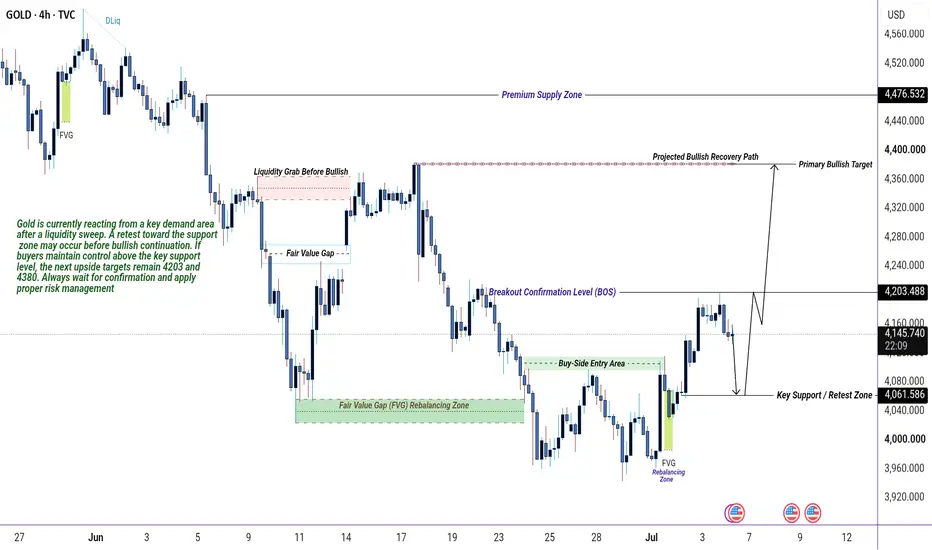
XAUUSD (GOLD) 4H | Smart Money Concepts, FVG & Liquidity Analysis
This chart is prepared purely for educational and market structure learning purposes using the principles of Smart Money Concepts (SMC), Fair Value Gaps (FVG), liquidity sweeps, institutional order flow, and market structure analysis. The objective of this analysis is to demonstrate how institutional traders may manipulate liquidity, create imbalances, and establish positions before initiating the next major directional move
1. Initial Fair Value Gap (FVG) Formation
At the left side of the chart, the highlighted bullish Fair Value Gap (FVG) represents an imbalance created after an impulsive bullish candle. This imbalance occurred because buying pressure was significantly stronger than selling pressure, leaving inefficient price action behind. In Smart Money Concepts, these zones often act as future areas of interest because institutions may revisit them to rebalance their positions before continuing the trend
2. Buy-Side Liquidity Collection (DLiq)
The market then moved upward and collected liquidity resting above previous highs, marked as DLiq (Draw on Liquidity). This liquidity collection phase is important because institutional participants frequently target areas where retail traders place stop losses and breakout orders. Once sufficient liquidity is accumulated, the market often reverses sharply, creating the next expansion phase
3. Bearish Market Structure Shift
Following the liquidity grab, a strong bearish displacement candle appeared, breaking the previous bullish structure. This move indicated that institutional sellers had gained control of the market. The sharp downward movement created a market structure shift, which is one of the most important confirmations in Smart Money Concepts analysis
4. Liquidity Grab Before Bullish Expansion
The highlighted red zone represents a temporary liquidity collection area. Price revisited this area before continuing lower, demonstrating how institutions often mitigate previous positions and absorb liquidity before initiating another directional move. This process creates traps for late buyers while allowing larger market participants to position themselves efficiently
5. Fair Value Gap Retest Zone
The blue highlighted imbalance area represents a Fair Value Gap created during the bearish expansion phase. Price revisited this zone and reacted, confirming that institutions were rebalancing previous inefficiencies. FVG zones frequently act as support and resistance levels because they represent areas where market orders previously overwhelmed limit orders.
6. Institutional Demand Zone Creation
After several strong bearish candles, price reached a major demand area highlighted in green. This area represents a potential institutional accumulation zone where buyers may begin entering the market. The strong bullish reaction from this level indicates that significant liquidity was absorbed by market participants.
7. Fair Value Gap Rebalancing Zone
The lower green highlighted area represents a Fair Value Gap rebalancing zone. This area is important because it shows where the market corrected previous inefficiencies before initiating the current recovery phase. Institutions often use these zones to accumulate positions while retail participants remain uncertain about market direction
8. Buy-Side Entry Area
The marked Buy-Side Entry Area represents the first zone where bullish momentum began returning. The formation of higher lows and bullish displacement candles suggests that buyers are gradually regaining control. However, this area should always be confirmed through additional market structure analysis and price action confirmation.
9. Breakout Confirmation Level (BOS)
The Breakout Confirmation Level (BOS) around the 4203 area represents a critical market structure resistance level. This level acts as confirmation that the market has shifted from short-term bearish pressure into a potential bullish continuation phase. A successful breakout above this zone would indicate increased buying strength and institutional participation.
10. Key Support / Retest Zone
The Key Support / Retest Zone near 4061 acts as a critical validation level for the bullish scenario. Markets rarely move in a straight line, and institutional traders often revisit important support zones before continuing toward higher targets. This retest area provides an opportunity to confirm whether buyers remain in control.
11. Projected Bullish Recovery Path
The projected bullish path shown on the chart illustrates a possible institutional accumulation and expansion scenario. According to Smart Money Concepts theory, after liquidity collection and rebalancing, the market may continue toward unfilled liquidity pools and premium pricing zones.
12. Primary Bullish Target
The Primary Bullish Target around the 4380 area represents the next major liquidity objective. This zone aligns with previous market inefficiencies and institutional order flow areas where profit-taking or additional selling pressure may emerge
13. Premium Supply Zone
The upper resistance zone marked as Premium Supply Zone represents a potential institutional selling area. If price reaches this level, market participants should observe price action carefully because this area may produce rejection, profit-taking, or another liquidity sweep
Educational Conclusion
This chart demonstrates several key Smart Money Concepts principles, including:
Liquidity Sweeps
Fair Value Gap (FVG) Rebalancing
Market Structure Shift (MSS)
Break of Structure (BOS)
Institutional Supply and Demand Zones
Liquidity Collection and Distribution
Market Inefficiencies and Rebalancing
Bullish Recovery and Expansion Phases
This analysis is created strictly for educational purposes only and should not be considered financial advice. Market conditions can change rapidly, and traders should always wait for confirmation signals, apply proper risk management, and use their own analysis before entering any trade.
This chart is prepared purely for educational and market structure learning purposes using the principles of Smart Money Concepts (SMC), Fair Value Gaps (FVG), liquidity sweeps, institutional order flow, and market structure analysis. The objective of this analysis is to demonstrate how institutional traders may manipulate liquidity, create imbalances, and establish positions before initiating the next major directional move
1. Initial Fair Value Gap (FVG) Formation
At the left side of the chart, the highlighted bullish Fair Value Gap (FVG) represents an imbalance created after an impulsive bullish candle. This imbalance occurred because buying pressure was significantly stronger than selling pressure, leaving inefficient price action behind. In Smart Money Concepts, these zones often act as future areas of interest because institutions may revisit them to rebalance their positions before continuing the trend
2. Buy-Side Liquidity Collection (DLiq)
The market then moved upward and collected liquidity resting above previous highs, marked as DLiq (Draw on Liquidity). This liquidity collection phase is important because institutional participants frequently target areas where retail traders place stop losses and breakout orders. Once sufficient liquidity is accumulated, the market often reverses sharply, creating the next expansion phase
3. Bearish Market Structure Shift
Following the liquidity grab, a strong bearish displacement candle appeared, breaking the previous bullish structure. This move indicated that institutional sellers had gained control of the market. The sharp downward movement created a market structure shift, which is one of the most important confirmations in Smart Money Concepts analysis
4. Liquidity Grab Before Bullish Expansion
The highlighted red zone represents a temporary liquidity collection area. Price revisited this area before continuing lower, demonstrating how institutions often mitigate previous positions and absorb liquidity before initiating another directional move. This process creates traps for late buyers while allowing larger market participants to position themselves efficiently
5. Fair Value Gap Retest Zone
The blue highlighted imbalance area represents a Fair Value Gap created during the bearish expansion phase. Price revisited this zone and reacted, confirming that institutions were rebalancing previous inefficiencies. FVG zones frequently act as support and resistance levels because they represent areas where market orders previously overwhelmed limit orders.
6. Institutional Demand Zone Creation
After several strong bearish candles, price reached a major demand area highlighted in green. This area represents a potential institutional accumulation zone where buyers may begin entering the market. The strong bullish reaction from this level indicates that significant liquidity was absorbed by market participants.
7. Fair Value Gap Rebalancing Zone
The lower green highlighted area represents a Fair Value Gap rebalancing zone. This area is important because it shows where the market corrected previous inefficiencies before initiating the current recovery phase. Institutions often use these zones to accumulate positions while retail participants remain uncertain about market direction
8. Buy-Side Entry Area
The marked Buy-Side Entry Area represents the first zone where bullish momentum began returning. The formation of higher lows and bullish displacement candles suggests that buyers are gradually regaining control. However, this area should always be confirmed through additional market structure analysis and price action confirmation.
9. Breakout Confirmation Level (BOS)
The Breakout Confirmation Level (BOS) around the 4203 area represents a critical market structure resistance level. This level acts as confirmation that the market has shifted from short-term bearish pressure into a potential bullish continuation phase. A successful breakout above this zone would indicate increased buying strength and institutional participation.
10. Key Support / Retest Zone
The Key Support / Retest Zone near 4061 acts as a critical validation level for the bullish scenario. Markets rarely move in a straight line, and institutional traders often revisit important support zones before continuing toward higher targets. This retest area provides an opportunity to confirm whether buyers remain in control.
11. Projected Bullish Recovery Path
The projected bullish path shown on the chart illustrates a possible institutional accumulation and expansion scenario. According to Smart Money Concepts theory, after liquidity collection and rebalancing, the market may continue toward unfilled liquidity pools and premium pricing zones.
12. Primary Bullish Target
The Primary Bullish Target around the 4380 area represents the next major liquidity objective. This zone aligns with previous market inefficiencies and institutional order flow areas where profit-taking or additional selling pressure may emerge
13. Premium Supply Zone
The upper resistance zone marked as Premium Supply Zone represents a potential institutional selling area. If price reaches this level, market participants should observe price action carefully because this area may produce rejection, profit-taking, or another liquidity sweep
Educational Conclusion
This chart demonstrates several key Smart Money Concepts principles, including:
Liquidity Sweeps
Fair Value Gap (FVG) Rebalancing
Market Structure Shift (MSS)
Break of Structure (BOS)
Institutional Supply and Demand Zones
Liquidity Collection and Distribution
Market Inefficiencies and Rebalancing
Bullish Recovery and Expansion Phases
This analysis is created strictly for educational purposes only and should not be considered financial advice. Market conditions can change rapidly, and traders should always wait for confirmation signals, apply proper risk management, and use their own analysis before entering any trade.
ノート
Educational Update Only
The analysis shared on this chart has played out according to the projected market structure, with price moving 400+ pips in the anticipated direction from the highlighted reaction zone.
This setup demonstrates how Smart Money Concepts (SMC), Fair Value Gaps (FVG), Liquidity Sweeps, Break of Structure (BOS), and Demand Zones can work together to identify high-probability market reactions.
The purpose of this chart is education only—to help traders understand how institutional price action develops step by step. Every marked level was placed to explain why price reacts at certain areas, where liquidity is collected, and how confirmations increase the probability of a successful trade.
Key Learning Points:
Wait for liquidity to be taken before looking for entries.
Use BOS as confirmation, not prediction.
FVGs often act as price rebalancing zones.
Demand and supply zones are areas of interest, not guaranteed reversal points.
Always combine market structure with proper risk management.
Result:
✅ Educational setup moved 400+ pips from the projected direction.

What You'll Get
Daily Forex signals with high accuracy
t.me/+qL2Xs8ZOehw0YmU8
fundamental analysis
Risk management tips to
protect your capital
Join now and start winning
t.me/+ilekoZUE8r1mZWI0
Daily Forex signals with high accuracy
t.me/+qL2Xs8ZOehw0YmU8
fundamental analysis
Risk management tips to
protect your capital
Join now and start winning
t.me/+ilekoZUE8r1mZWI0
関連の投稿
免責事項
これらの情報および投稿は、TradingViewが提供または承認する金融、投資、取引、またはその他の種類の助言もしくは推奨であることを意図したものではなく、またこれらに該当するものでもありません。詳細は利用規約をご覧ください。
What You'll Get
Daily Forex signals with high accuracy
t.me/+qL2Xs8ZOehw0YmU8
fundamental analysis
Risk management tips to
protect your capital
Join now and start winning
t.me/+ilekoZUE8r1mZWI0
Daily Forex signals with high accuracy
t.me/+qL2Xs8ZOehw0YmU8
fundamental analysis
Risk management tips to
protect your capital
Join now and start winning
t.me/+ilekoZUE8r1mZWI0
関連の投稿
免責事項
これらの情報および投稿は、TradingViewが提供または承認する金融、投資、取引、またはその他の種類の助言もしくは推奨であることを意図したものではなく、またこれらに該当するものでもありません。詳細は利用規約をご覧ください。