
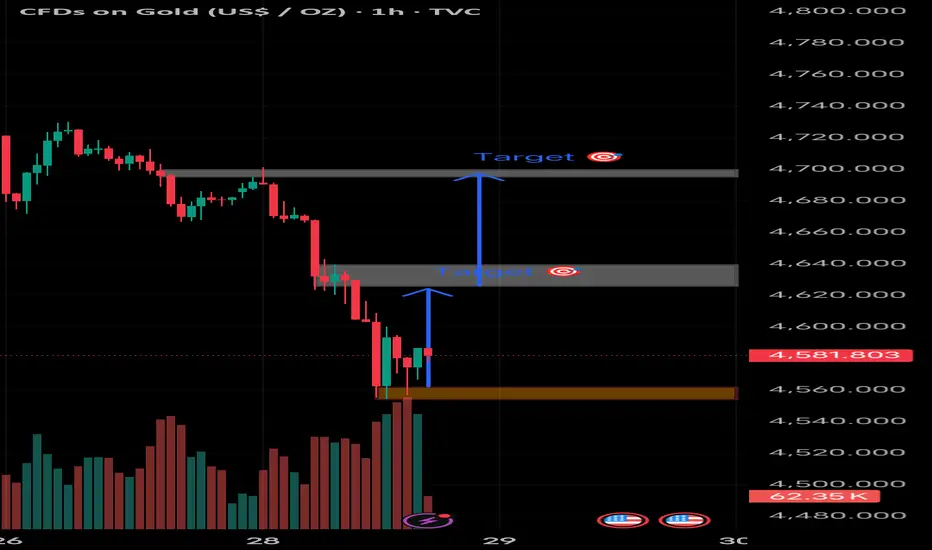
1H Chart 4,550–4,560 and I have marked two upside targets. Based on that structure:
Short-term upside targets:
Target 1: 4,620–4,640 (first supply / reaction zone)
Target 2: 4,690–4,710 (major resistance / previous breakdown area)
How to think about it:
The first target is the most realistic if this is just a relief bounce in a downtrend.
The second target likely needs stronger momentum or a shift in structure (higher highs forming).
Important context:
Trend is still bearish (clear lower highs + strong selloff), so these are counter-trend targets unless structure flips.
If price loses 4,550, my setup is invalid and downside continuation is likely.
Short-term upside targets:
Target 1: 4,620–4,640 (first supply / reaction zone)
Target 2: 4,690–4,710 (major resistance / previous breakdown area)
How to think about it:
The first target is the most realistic if this is just a relief bounce in a downtrend.
The second target likely needs stronger momentum or a shift in structure (higher highs forming).
Important context:
Trend is still bearish (clear lower highs + strong selloff), so these are counter-trend targets unless structure flips.
If price loses 4,550, my setup is invalid and downside continuation is likely.

関連の投稿
免責事項
これらの情報および投稿は、TradingViewが提供または承認する金融、投資、取引、またはその他の種類の助言もしくは推奨であることを意図したものではなく、またこれらに該当するものでもありません。詳細は利用規約をご覧ください。
関連の投稿
免責事項
これらの情報および投稿は、TradingViewが提供または承認する金融、投資、取引、またはその他の種類の助言もしくは推奨であることを意図したものではなく、またこれらに該当するものでもありません。詳細は利用規約をご覧ください。