
Overall structure
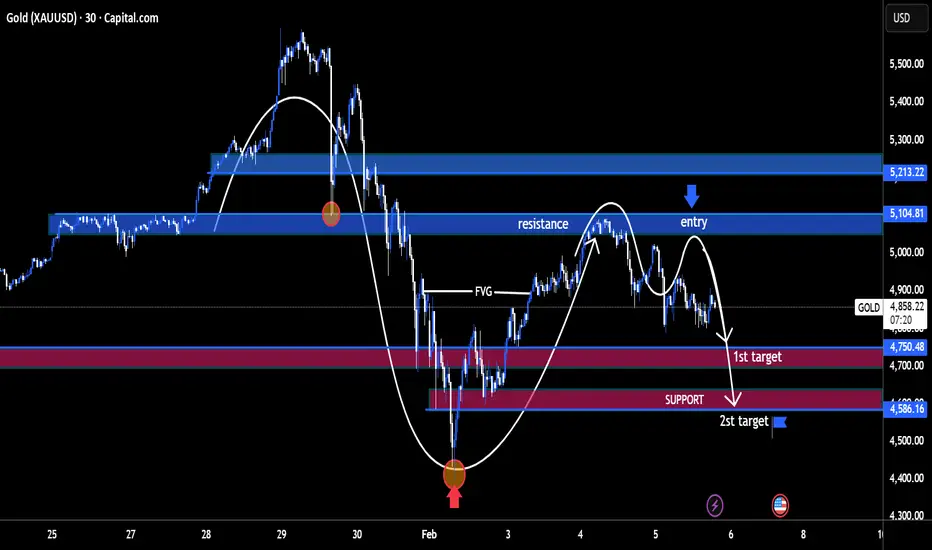
Gold is in a short-term bearish correction after a strong impulsive sell-off. The left side of the chart shows a distribution → breakdown → liquidity sweep, followed by a corrective bounce that is now losing steam.
Key zones & story the chart tells
Major Resistance Zone (≈ 5,105 – 5,213)
This blue zone previously acted as support, then flipped to resistance. Price has revisited it and failed to reclaim, confirming a classic support → resistance flip.
Entry Area (around 5,100)
The pullback into resistance aligns with:
Lower-high structure
Bearish reaction after a corrective rally
Rejection near prior consolidation
This is the logical short entry zone, as marked.
Fair Value Gap (FVG)
The rally partially filled the FVG but failed to continue higher — another sign of weak bullish intent.
Notice the white projected path: price is respecting a corrective wave rather than impulsive buying.
Targets
1st Target: ~4,750
Prior reaction level and mid-range liquidity. Likely pause or partial take-profit zone.
2nd Target / Support: ~4,586
Strong demand zone and previous base. This is the main downside objective if bearish momentum continues.
Bias summary
Bias: Bearish below 5,105
Invalidation: Clean break and hold above 5,213
Market logic:
Distribution → breakdown → pullback into resistance → continuation lower
Big picture takeaway
This is a textbook pullback-short setup after a strong bearish impulse. As long as gold remains capped below the resistance band, the path of least resistance points down toward 4,750 and potentially 4,586.
Gold is in a short-term bearish correction after a strong impulsive sell-off. The left side of the chart shows a distribution → breakdown → liquidity sweep, followed by a corrective bounce that is now losing steam.
Key zones & story the chart tells
Major Resistance Zone (≈ 5,105 – 5,213)
This blue zone previously acted as support, then flipped to resistance. Price has revisited it and failed to reclaim, confirming a classic support → resistance flip.
Entry Area (around 5,100)
The pullback into resistance aligns with:
Lower-high structure
Bearish reaction after a corrective rally
Rejection near prior consolidation
This is the logical short entry zone, as marked.
Fair Value Gap (FVG)
The rally partially filled the FVG but failed to continue higher — another sign of weak bullish intent.
Notice the white projected path: price is respecting a corrective wave rather than impulsive buying.
Targets
1st Target: ~4,750
Prior reaction level and mid-range liquidity. Likely pause or partial take-profit zone.
2nd Target / Support: ~4,586
Strong demand zone and previous base. This is the main downside objective if bearish momentum continues.
Bias summary
Bias: Bearish below 5,105
Invalidation: Clean break and hold above 5,213
Market logic:
Distribution → breakdown → pullback into resistance → continuation lower
Big picture takeaway
This is a textbook pullback-short setup after a strong bearish impulse. As long as gold remains capped below the resistance band, the path of least resistance points down toward 4,750 and potentially 4,586.
トレード稼働中

免責事項
これらの情報および投稿は、TradingViewが提供または承認する金融、投資、取引、またはその他の種類の助言もしくは推奨であることを意図したものではなく、またこれらに該当するものでもありません。詳細は利用規約をご覧ください。
免責事項
これらの情報および投稿は、TradingViewが提供または承認する金融、投資、取引、またはその他の種類の助言もしくは推奨であることを意図したものではなく、またこれらに該当するものでもありません。詳細は利用規約をご覧ください。