
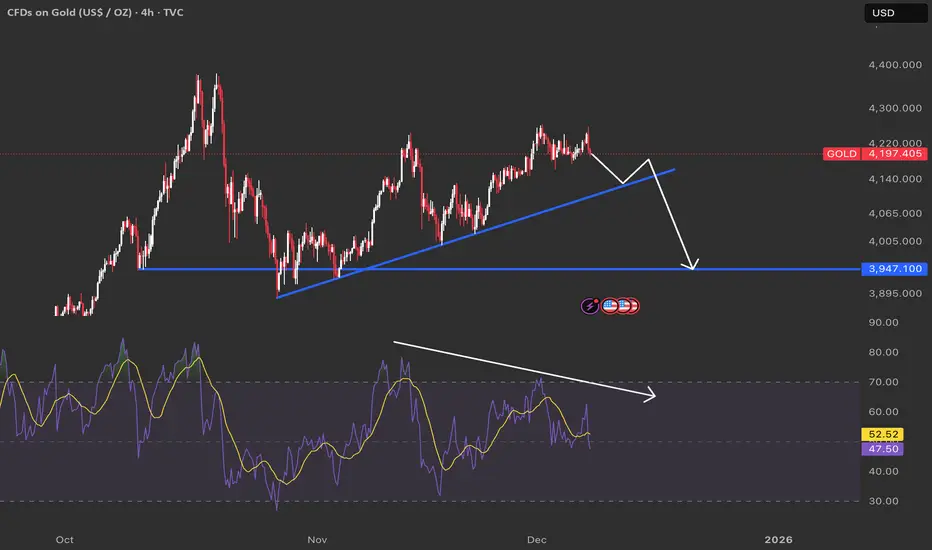
- Price is riding a clean rising trendline from the October lows, connecting multiple higher swing lows.
- A break and retest of this blue trendline would signal fading momentum and open the door for a deeper correction toward horizontal support.
🧱 Why 3,947 is strong support
- 3,947 marks the previous consolidation base where buyers stepped in aggressively after the last sharp sell‑off, turning it into a clear demand zone.
- It also aligns with the last major 4H swing low, so many stop‑losses and resting buy orders are likely clustered there, making it a natural magnet if the trendline fails.
📉 Bearish divergence
- While price made higher highs on the 4H chart, the RSI printed lower highs, creating a clear bearish divergence.
- This divergence suggests buyers are losing strength, increasing the probability of a trendline break and a move down into the 3,947 support area before any new major leg higher.

免責事項
これらの情報および投稿は、TradingViewが提供または承認する金融、投資、取引、またはその他の種類の助言もしくは推奨であることを意図したものではなく、またこれらに該当するものでもありません。詳細は利用規約をご覧ください。
免責事項
これらの情報および投稿は、TradingViewが提供または承認する金融、投資、取引、またはその他の種類の助言もしくは推奨であることを意図したものではなく、またこれらに該当するものでもありません。詳細は利用規約をご覧ください。