
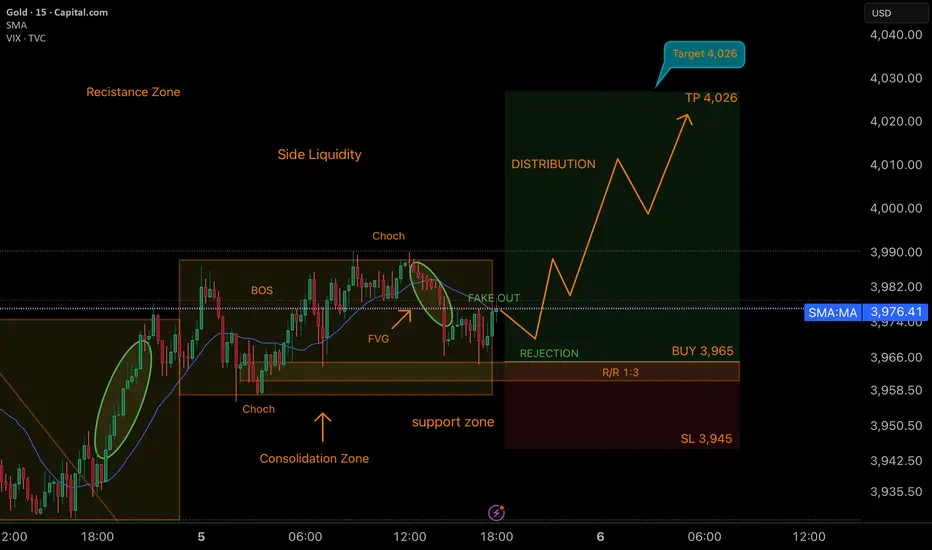
Bullish Analysis Breakdown – XAU/USD (15M)
🧠 Market Structure
The chart shows a shift in structure with a clear BOS (Break of Structure) and CHOCH (Change of Character) after a period of Consolidation.
Price creates a Fair Value Gap (FVG) during the bullish move, and later performs a Fake Out below the support zone to grab Sell-Side Liquidity before rejecting strongly back into structure — a classic institutional move.
The rejection at the support zone confirms that institutions have accumulated positions and are now ready to drive the market toward new highs.
🧩 Confluences
• Support Zone + Rejection: Price reacts perfectly after the fake-out, confirming demand.
• FVG Mitigation: The fair value gap adds confluence to the bullish rejection.
• Liquidity Grab: Sell-side liquidity was cleared before the bullish push.
• Distribution Phase: The projection shows a possible redistribution before reaching TP.
🎯 Trade Plan
• Buy Entry: 3,965
• Stop Loss: 3,945
• Take Profit: 4,026
• Risk/Reward Ratio: 1:3
This setup shows clean institutional alignment — liquidity taken, structure shift, rejection, and continuation toward buy-side targets.
💬 Conclusion
A very professional analysis that combines structure, liquidity, and confluences in harmony.
“Smart trading begins with patience and precision.”
FOOD LUCK TRADERS 🦾🤓🖤💸

免責事項
これらの情報および投稿は、TradingViewが提供または承認する金融、投資、取引、またはその他の種類の助言もしくは推奨であることを意図したものではなく、またこれらに該当するものでもありません。詳細は利用規約をご覧ください。
免責事項
これらの情報および投稿は、TradingViewが提供または承認する金融、投資、取引、またはその他の種類の助言もしくは推奨であることを意図したものではなく、またこれらに該当するものでもありません。詳細は利用規約をご覧ください。