
Dear Trader,
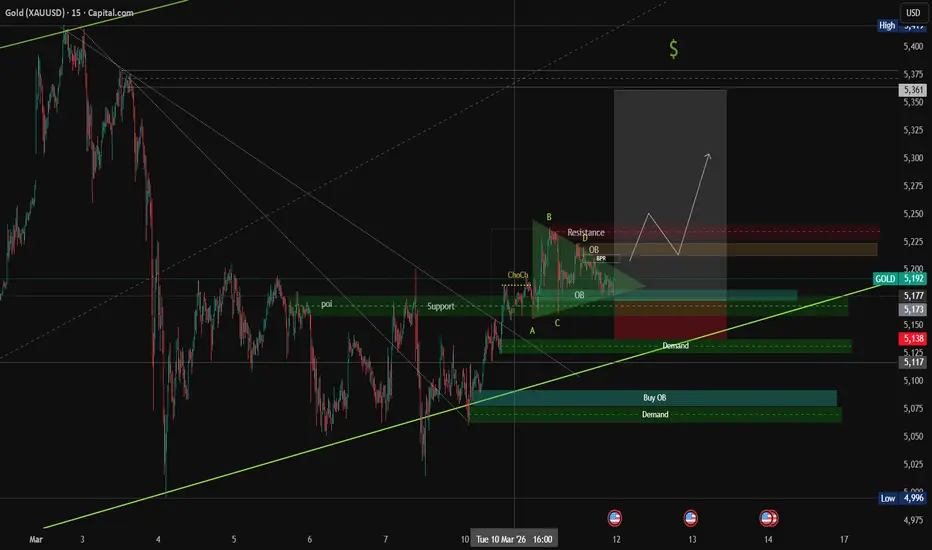
Please see GOLD 15 Chart Analysis based on many confluences.
Market Structure:
* A clear CHoCH (Change of Character) confirms a bullish shift, meaning control has moved from sellers to buyers.
Current Zone:
* Price broke above prior resistance, now retesting it as support (POI) — a typical bullish continuation setup.
Confluence:
* Bullish Symmetrical Triangle forming — tightening structure shows accumulation before a potential breakout.
* Buy OB and Demand Zone lie directly beneath current price, providing strong support.
* BPR and Sell OB rest along the upper triangle boundary, creating a reaction area or possible short-term rejection zone.
* ABCD pattern suggests higher targets once the retest holds.
Trading Plan:
Bullish Bias (Primary):
Wait for confirmation candle or BOS after retest of the new support zone (POI).
Entry: near the Buy OB/Demand or upon break of triangle resistance.
Targets: 5,240 → 5,360.
Invalidation: Break below 5,130 (Buy OB low) cancels the bullish setup.
Bearish Bias (Counter-trade):
If price rejects sharply from Sell OB / BPR / upper triangle resistance, and fails to reclaim 5,200 — short setups may form.
Targets: back to 5,160 → 5,130 (Demand zones)
Like, comments and boost if you like the analysis.
The Quantum Trader
Please see GOLD 15 Chart Analysis based on many confluences.
Market Structure:
* A clear CHoCH (Change of Character) confirms a bullish shift, meaning control has moved from sellers to buyers.
Current Zone:
* Price broke above prior resistance, now retesting it as support (POI) — a typical bullish continuation setup.
Confluence:
* Bullish Symmetrical Triangle forming — tightening structure shows accumulation before a potential breakout.
* Buy OB and Demand Zone lie directly beneath current price, providing strong support.
* BPR and Sell OB rest along the upper triangle boundary, creating a reaction area or possible short-term rejection zone.
* ABCD pattern suggests higher targets once the retest holds.
Trading Plan:
Bullish Bias (Primary):
Wait for confirmation candle or BOS after retest of the new support zone (POI).
Entry: near the Buy OB/Demand or upon break of triangle resistance.
Targets: 5,240 → 5,360.
Invalidation: Break below 5,130 (Buy OB low) cancels the bullish setup.
Bearish Bias (Counter-trade):
If price rejects sharply from Sell OB / BPR / upper triangle resistance, and fails to reclaim 5,200 — short setups may form.
Targets: back to 5,160 → 5,130 (Demand zones)
Like, comments and boost if you like the analysis.
The Quantum Trader
トレード終了: ストップロスに到達
Stop Loss Hit. No Stress, its part of the risk management. never compromise with your trading plan 
関連の投稿
免責事項
これらの情報および投稿は、TradingViewが提供または承認する金融、投資、取引、またはその他の種類の助言もしくは推奨であることを意図したものではなく、またこれらに該当するものでもありません。詳細は利用規約をご覧ください。
免責事項
これらの情報および投稿は、TradingViewが提供または承認する金融、投資、取引、またはその他の種類の助言もしくは推奨であることを意図したものではなく、またこれらに該当するものでもありません。詳細は利用規約をご覧ください。