
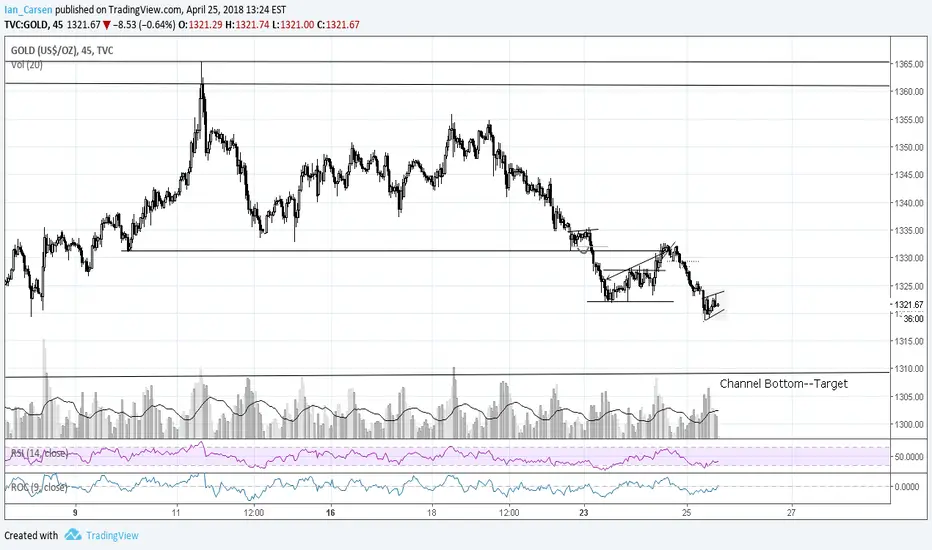
With recent dollar strength and treasury weakness, commodities are taking the hit. Here we have a classic bear flag in Gold A longer-term chart shows Gold in a large rectangular consolidation inside an ascending triangle (triangle on the weekly chart). A break of the bear flag should take price to the boundary of the larger rectangular consolidation, where price may proceed (probably after a partial rise) to fall to the boundary of the triangle, where I would expect it to reverse upwards, however, continuation of the downwards action is always possible.
Good trading and good luck!
Good trading and good luck!

免責事項
これらの情報および投稿は、TradingViewが提供または承認する金融、投資、取引、またはその他の種類の助言もしくは推奨であることを意図したものではなく、またこれらに該当するものでもありません。詳細は利用規約をご覧ください。
免責事項
これらの情報および投稿は、TradingViewが提供または承認する金融、投資、取引、またはその他の種類の助言もしくは推奨であることを意図したものではなく、またこれらに該当するものでもありません。詳細は利用規約をご覧ください。