
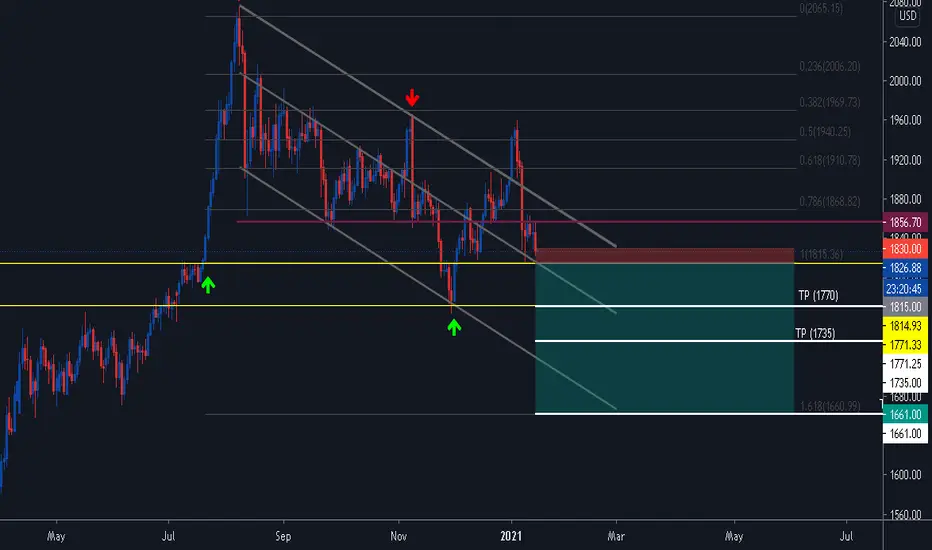
Daily Gold Analysis
Since the beginning of August, we have been in a short-term downtrend represented by the white channel. The price is close to its support at 1815 and could break it again to hit 1770 (take profit 1) however the 1770 represents a huge support area where the price could rebound. If this is not the case the price could suddenly reach 1735 (take profit 2) and 1661 (take profit 3) which represents the 1.618 of Fibonacci retracements.
Good trade everyone.
Since the beginning of August, we have been in a short-term downtrend represented by the white channel. The price is close to its support at 1815 and could break it again to hit 1770 (take profit 1) however the 1770 represents a huge support area where the price could rebound. If this is not the case the price could suddenly reach 1735 (take profit 2) and 1661 (take profit 3) which represents the 1.618 of Fibonacci retracements.
Good trade everyone.

免責事項
これらの情報および投稿は、TradingViewが提供または承認する金融、投資、取引、またはその他の種類の助言もしくは推奨であることを意図したものではなく、またこれらに該当するものでもありません。詳細は利用規約をご覧ください。
免責事項
これらの情報および投稿は、TradingViewが提供または承認する金融、投資、取引、またはその他の種類の助言もしくは推奨であることを意図したものではなく、またこれらに該当するものでもありません。詳細は利用規約をご覧ください。