
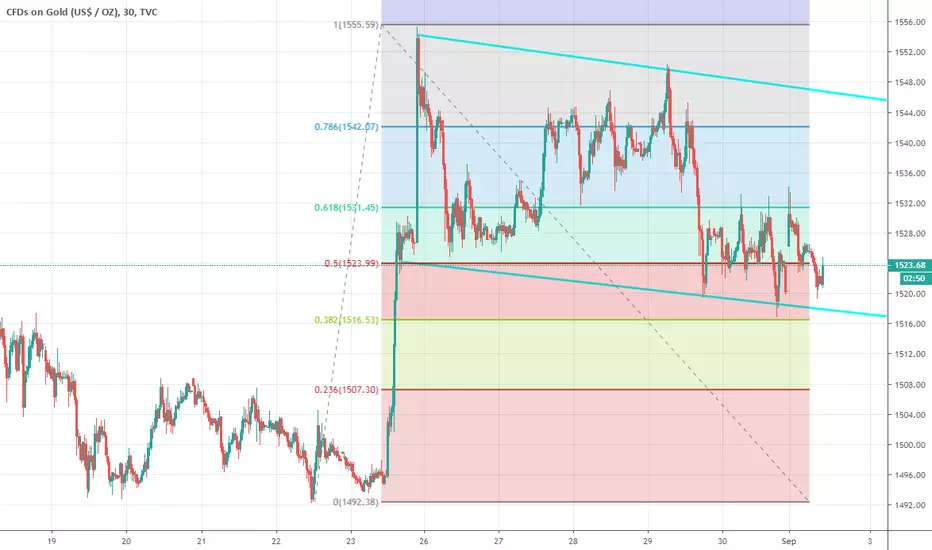
I know this one goes against my previous gold chart, but I think that this one can't be ignored. This looks like a huge/long bull flag on 30 min, price has closed below fib 50 level, which can mean thats it's not valid, but on my MT4 chart this close has been really smal and short, even if that's not a bull flag then it's a nice chanel. keep in mind this one, and remember USD will come down sooner or later. Lets see how this one plays out.
Good luck and enjoy trading!
My telegram small group. t.me/joinchat/KPtBs06gzWxrYDrhCoWGYA
Good luck and enjoy trading!
My telegram small group. t.me/joinchat/KPtBs06gzWxrYDrhCoWGYA
トレード稼働中
Top line touched, Let see if we go back down or we break it and fly.
免責事項
これらの情報および投稿は、TradingViewが提供または承認する金融、投資、取引、またはその他の種類の助言もしくは推奨であることを意図したものではなく、またこれらに該当するものでもありません。詳細は利用規約をご覧ください。
免責事項
これらの情報および投稿は、TradingViewが提供または承認する金融、投資、取引、またはその他の種類の助言もしくは推奨であることを意図したものではなく、またこれらに該当するものでもありません。詳細は利用規約をご覧ください。