
Visit fourtrades website for more insight
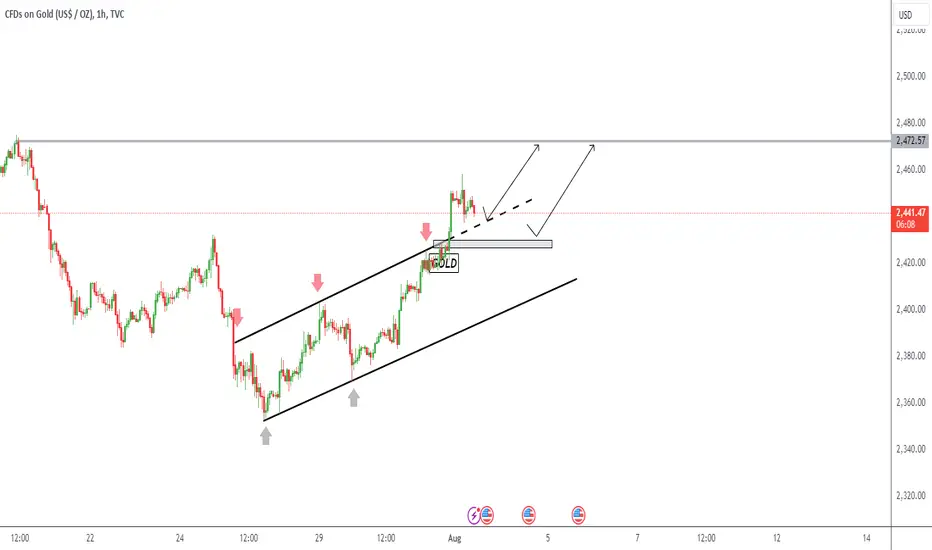
The 1-hour chart shows a clear uptrend with gold trading within an ascending channel. The price has recently tested the upper boundary of this channel and is now experiencing a minor pullback. A critical support level to watch is around $2,430, marked by the lower trendline of the ascending channel and previous price action.
Key Observations:
Support: $2,430
Resistance: $2,472
Potential Scenarios:
Bullish Continuation: A bounce off the lower trendline could see the price retest the $2,472 resistance level.
Bearish Correction: A break below the $2,430 support could lead to further downside, potentially targeting the next support level around $2,400.
The 1-hour chart shows a clear uptrend with gold trading within an ascending channel. The price has recently tested the upper boundary of this channel and is now experiencing a minor pullback. A critical support level to watch is around $2,430, marked by the lower trendline of the ascending channel and previous price action.
Key Observations:
Support: $2,430
Resistance: $2,472
Potential Scenarios:
Bullish Continuation: A bounce off the lower trendline could see the price retest the $2,472 resistance level.
Bearish Correction: A break below the $2,430 support could lead to further downside, potentially targeting the next support level around $2,400.

免責事項
これらの情報および投稿は、TradingViewが提供または承認する金融、投資、取引、またはその他の種類の助言もしくは推奨であることを意図したものではなく、またこれらに該当するものでもありません。詳細は利用規約をご覧ください。
免責事項
これらの情報および投稿は、TradingViewが提供または承認する金融、投資、取引、またはその他の種類の助言もしくは推奨であることを意図したものではなく、またこれらに該当するものでもありません。詳細は利用規約をご覧ください。