
Google Tests a Critical Support Zone — Can Buyers Reverse the Trend?
Market Structure
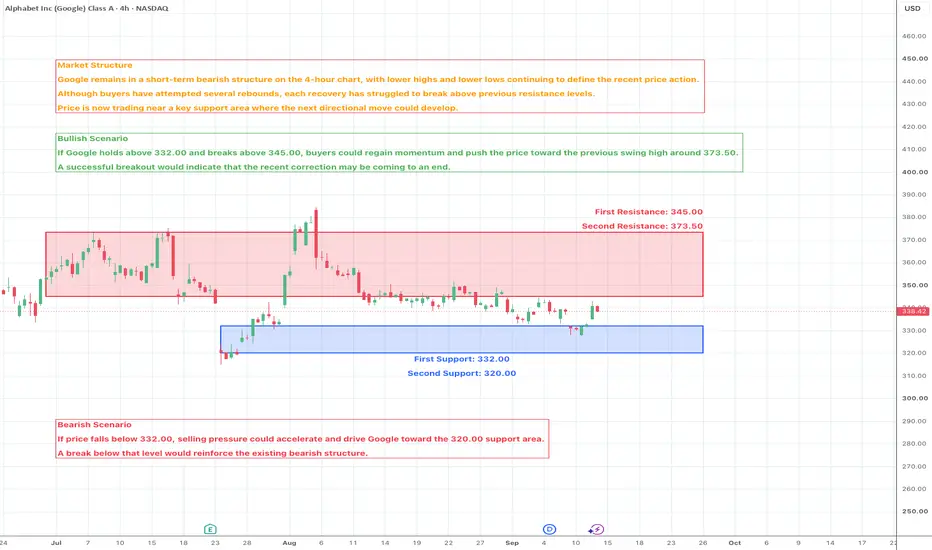
Google remains in a short-term bearish structure on the 4-hour chart, with lower highs and lower lows continuing to define the recent price action. Although buyers have attempted several rebounds, each recovery has struggled to break above previous resistance levels. Price is now trading near a key support area where the next directional move could develop.
Market Sentiment - Moderately Bearish
Market sentiment remains moderately bearish. Selling pressure has eased compared to the previous decline, but buyers have yet to produce a convincing breakout that would signal a meaningful trend reversal.
Bullish Scenario
If Google holds above 332.00 and breaks above 345.00, buyers could regain momentum and push price toward the previous swing high around 373.50. A successful breakout would indicate that the recent correction may be coming to an end.
Bearish Scenario
If price falls below 332.00, selling pressure could accelerate and drive Google toward the 320.00 support area. A break below that level would reinforce the existing bearish structure.
────────────────────
Market Outlook
Google remains under pressure after failing to sustain its previous rally. While recent buying interest has helped stabilize price, the overall structure still favors sellers until a clear breakout above resistance is confirmed.
────────────────────
Key Levels
First Resistance: 345.00
Second Resistance: 373.50
First Support: 332.00
Second Support: 320.00
────────────────────
Future Scenarios
A sustained move above the First Resistance would indicate that buyers are regaining control and could drive price toward the Second Resistance.
However, if price falls below the First Support, selling pressure could increase toward the Second Support.
────────────────────
Event Risk
Google's short-term direction may continue to be influenced by overall U.S. equity market sentiment, Treasury yields, economic data, AI-related developments, and company-specific news.
However, price action remains the most important signal. If positive news cannot lift price above the First Resistance, it would suggest buying momentum remains limited. Conversely, if Google loses the First Support despite improving market sentiment, the broader bearish structure would remain intact.
────────────────────
Please share your view below:
Do you think Google can reclaim the 345.00 resistance and start a new bullish phase, or will the current downtrend continue?
More market structure and key level updates will be shared regularly.
Market Structure
Google remains in a short-term bearish structure on the 4-hour chart, with lower highs and lower lows continuing to define the recent price action. Although buyers have attempted several rebounds, each recovery has struggled to break above previous resistance levels. Price is now trading near a key support area where the next directional move could develop.
Market Sentiment - Moderately Bearish
Market sentiment remains moderately bearish. Selling pressure has eased compared to the previous decline, but buyers have yet to produce a convincing breakout that would signal a meaningful trend reversal.
Bullish Scenario
If Google holds above 332.00 and breaks above 345.00, buyers could regain momentum and push price toward the previous swing high around 373.50. A successful breakout would indicate that the recent correction may be coming to an end.
Bearish Scenario
If price falls below 332.00, selling pressure could accelerate and drive Google toward the 320.00 support area. A break below that level would reinforce the existing bearish structure.
────────────────────
Market Outlook
Google remains under pressure after failing to sustain its previous rally. While recent buying interest has helped stabilize price, the overall structure still favors sellers until a clear breakout above resistance is confirmed.
────────────────────
Key Levels
First Resistance: 345.00
Second Resistance: 373.50
First Support: 332.00
Second Support: 320.00
────────────────────
Future Scenarios
A sustained move above the First Resistance would indicate that buyers are regaining control and could drive price toward the Second Resistance.
However, if price falls below the First Support, selling pressure could increase toward the Second Support.
────────────────────
Event Risk
Google's short-term direction may continue to be influenced by overall U.S. equity market sentiment, Treasury yields, economic data, AI-related developments, and company-specific news.
However, price action remains the most important signal. If positive news cannot lift price above the First Resistance, it would suggest buying momentum remains limited. Conversely, if Google loses the First Support despite improving market sentiment, the broader bearish structure would remain intact.
────────────────────
Please share your view below:
Do you think Google can reclaim the 345.00 resistance and start a new bullish phase, or will the current downtrend continue?
More market structure and key level updates will be shared regularly.

関連の投稿
免責事項
これらの情報および投稿は、TradingViewが提供または承認する金融、投資、取引、またはその他の種類の助言もしくは推奨であることを意図したものではなく、またこれらに該当するものでもありません。詳細は利用規約をご覧ください。
免責事項
これらの情報および投稿は、TradingViewが提供または承認する金融、投資、取引、またはその他の種類の助言もしくは推奨であることを意図したものではなく、またこれらに該当するものでもありません。詳細は利用規約をご覧ください。