
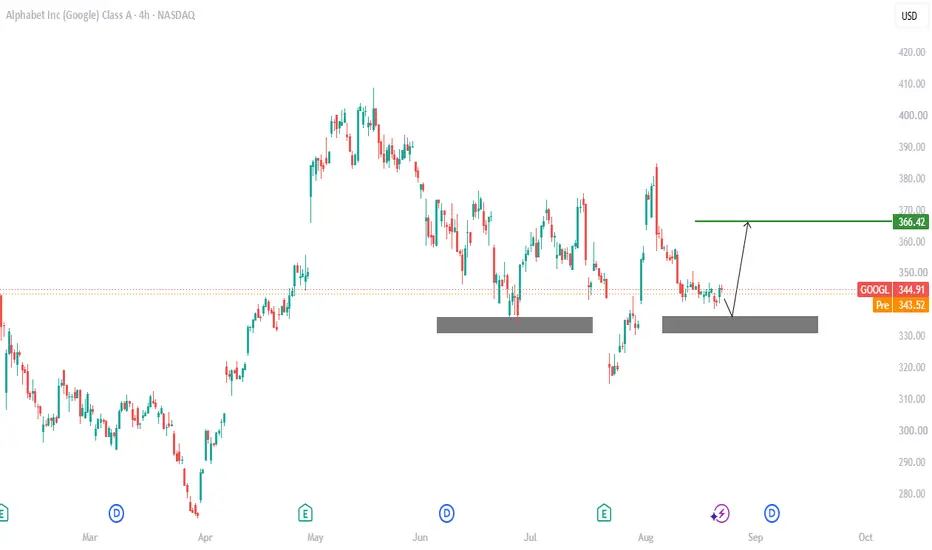
Alphabet (Google) stock trades near $339-$343 with a market cap around $4.18 trillion. Recent news features Google expanding its custom AI chip partnership with Marvell Technology, involving stock warrants, alongside market focus on upcoming Nvidia earnings and broad AI infrastructure spending.
Technical Insight:
GOOGL is fluctuating on a sell momentum. Stock persists to trend on downward pathway, with lower lows and highs, in concern to the framework. We can spot a partial formation of Inverse Head and Shoulders pattern, as there is fair chance of buy retracement.
Key Point:
A confirmed pullback within this zone, activates a long position to $366, as next possible bullish.
Thanks for reading.
Technical Insight:
GOOGL is fluctuating on a sell momentum. Stock persists to trend on downward pathway, with lower lows and highs, in concern to the framework. We can spot a partial formation of Inverse Head and Shoulders pattern, as there is fair chance of buy retracement.
Key Point:
A confirmed pullback within this zone, activates a long position to $366, as next possible bullish.
Thanks for reading.
トレード稼働中
GOOGL is still moving as predicted!Stay tune.

免責事項
これらの情報および投稿は、TradingViewが提供または承認する金融、投資、取引、またはその他の種類の助言もしくは推奨であることを意図したものではなく、またこれらに該当するものでもありません。詳細は利用規約をご覧ください。
免責事項
これらの情報および投稿は、TradingViewが提供または承認する金融、投資、取引、またはその他の種類の助言もしくは推奨であることを意図したものではなく、またこれらに該当するものでもありません。詳細は利用規約をご覧ください。