
1. The Macro Perspective: The Deep Washout and Rounding Base
I am taking a LONG bias on Granules India Limited (GRANULES) on the weekly (1W) timeframe.
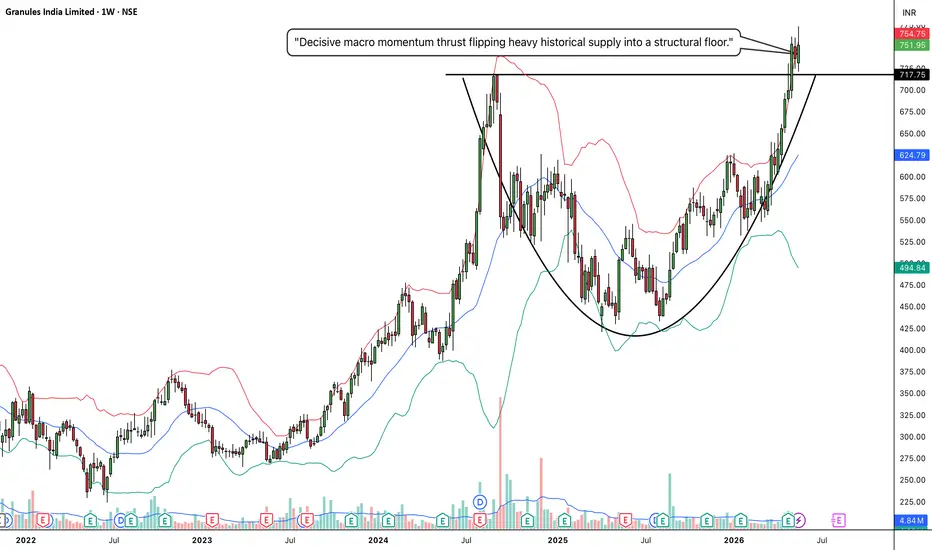
When analyzing pure market structure on a macro level, the most powerful and sustainable trends emerge from deep, well-rounded accumulation structures. Look at the comprehensive development displayed in Screenshot 2026-05-23 at 17.10.58.jpg. After hitting a major structural peak in mid-2024, the stock entered a long, grueling digestion cycle that washed out weak hands down toward the 400-425 zone. Instead of collapsing into a permanent downtrend, institutional capital heavily stepped in to absorb supply. Over the last two years, the stock has beautifully carved out a massive, symmetrical rounding accumulation base (Cup formation), methodically shifting shares from weak retail hands to strong-handed institutional portfolios.
2. The Educational Setup: Reclaiming Key Pillars and Neckline Squeeze
To understand the sheer technical validity behind this massive structural breakout, we look at the confluence of dynamic indicators and key price parameters across the chart:
The 20 SMA Springboard: Notice how cleanly the price action behaved on the right side of the rounding curve. Once the stock recovered from its macro lows, it decisively reclaimed the rising weekly 20 SMA (the middle blue line of your Bollinger Bands, currently near 624.79). This moving average was aggressively defended during every minor weekly dip, serving as a dynamic rising launchpad for the macro markup phase.
The Ultimate Ceiling: The defining boundary for this entire multi-year pattern is the solid black horizontal neckline drawn at 717.75. This level marks the final major structural roadblock where sellers historically stepped in to halt the bull run. As the price climbed back to this line, it compressed heavily against the resistance, coiling the spring with immense kinetic energy beneath the surface.
3. Current Price Action: Volatility Expansion and Blue Sky Entry
Look closely at the most recent weekly candles on the far right of the chart. The technical pressure cooker has officially blown its lid off. Buyers have stepped in with massive conviction, printing a sequence of powerful green expansion candles that have completely shattered the 717.75 multi-year ceiling. The stock has printed fresh lifetime highs up near 754.75 and is currently holding strong. Furthermore, the price has violently pierced and begun riding outside the upper Bollinger Band, forcing the band boundaries to snap wide open. This represents a classic structural transition from low-volatility compression into a high-volatility macro markup phase, clearing out all historical overhead supply.
4. The Trade Plan: Entries, Targets, and Risk Management
Entry Strategy: Macro momentum is exceptionally strong. Chasing a vertical weekly run entirely outside the upper Bollinger Band carries a minor risk of a short-term mean-reversion pullback on lower timeframes. The highest-probability, lowest-risk entry involves letting the immediate breakout excitement cool off. Look to scale into long positions or place limit orders to catch a potential structural retest of the broken neckline zone between 710.00 and 725.00. Letting old historical resistance prove itself as a concrete new support floor offers an exceptional risk-to-reward ratio.
Take Profit (Targets): Because the stock is breaking out of a massive multi-year rounding structure into unchartered blue-sky territory, we use a measured move strategy based on the depth of the base. By taking the core depth of the Cup (roughly 300 points from the ~417 structural floor up to the 717.75 ceiling) and projecting it upward from the breakout point, our primary macro target sits comfortably in the 1,000.00 to 1,020.00 zone. Intermediate psychological profit milestones rest at 850.00 and 900.00.
Invalidation (Stop Loss): An explosive macro breakout thesis is completely invalidated if the price fails to defend its newly claimed floor and collapses back inside the base. A hard stop loss should be placed safely below the rising weekly 20 SMA and the mid-curve structural pivots, specifically around the 610.00 to 630.00 level. A definitive weekly close completely back below 600 would act as a severe warning sign of a failed macro breakout and a major bull trap.
5. Time Horizon:
Because this technical setup is engineered on a 1-Week chart capturing a massive structural phase transition and a clean multi-year rounding breakout, this is a longer-term position trade designed to capture a secular markup phase over the coming months and quarters. Let the macro trend run!
I am taking a LONG bias on Granules India Limited (GRANULES) on the weekly (1W) timeframe.
When analyzing pure market structure on a macro level, the most powerful and sustainable trends emerge from deep, well-rounded accumulation structures. Look at the comprehensive development displayed in Screenshot 2026-05-23 at 17.10.58.jpg. After hitting a major structural peak in mid-2024, the stock entered a long, grueling digestion cycle that washed out weak hands down toward the 400-425 zone. Instead of collapsing into a permanent downtrend, institutional capital heavily stepped in to absorb supply. Over the last two years, the stock has beautifully carved out a massive, symmetrical rounding accumulation base (Cup formation), methodically shifting shares from weak retail hands to strong-handed institutional portfolios.
2. The Educational Setup: Reclaiming Key Pillars and Neckline Squeeze
To understand the sheer technical validity behind this massive structural breakout, we look at the confluence of dynamic indicators and key price parameters across the chart:
The 20 SMA Springboard: Notice how cleanly the price action behaved on the right side of the rounding curve. Once the stock recovered from its macro lows, it decisively reclaimed the rising weekly 20 SMA (the middle blue line of your Bollinger Bands, currently near 624.79). This moving average was aggressively defended during every minor weekly dip, serving as a dynamic rising launchpad for the macro markup phase.
The Ultimate Ceiling: The defining boundary for this entire multi-year pattern is the solid black horizontal neckline drawn at 717.75. This level marks the final major structural roadblock where sellers historically stepped in to halt the bull run. As the price climbed back to this line, it compressed heavily against the resistance, coiling the spring with immense kinetic energy beneath the surface.
3. Current Price Action: Volatility Expansion and Blue Sky Entry
Look closely at the most recent weekly candles on the far right of the chart. The technical pressure cooker has officially blown its lid off. Buyers have stepped in with massive conviction, printing a sequence of powerful green expansion candles that have completely shattered the 717.75 multi-year ceiling. The stock has printed fresh lifetime highs up near 754.75 and is currently holding strong. Furthermore, the price has violently pierced and begun riding outside the upper Bollinger Band, forcing the band boundaries to snap wide open. This represents a classic structural transition from low-volatility compression into a high-volatility macro markup phase, clearing out all historical overhead supply.
4. The Trade Plan: Entries, Targets, and Risk Management
Entry Strategy: Macro momentum is exceptionally strong. Chasing a vertical weekly run entirely outside the upper Bollinger Band carries a minor risk of a short-term mean-reversion pullback on lower timeframes. The highest-probability, lowest-risk entry involves letting the immediate breakout excitement cool off. Look to scale into long positions or place limit orders to catch a potential structural retest of the broken neckline zone between 710.00 and 725.00. Letting old historical resistance prove itself as a concrete new support floor offers an exceptional risk-to-reward ratio.
Take Profit (Targets): Because the stock is breaking out of a massive multi-year rounding structure into unchartered blue-sky territory, we use a measured move strategy based on the depth of the base. By taking the core depth of the Cup (roughly 300 points from the ~417 structural floor up to the 717.75 ceiling) and projecting it upward from the breakout point, our primary macro target sits comfortably in the 1,000.00 to 1,020.00 zone. Intermediate psychological profit milestones rest at 850.00 and 900.00.
Invalidation (Stop Loss): An explosive macro breakout thesis is completely invalidated if the price fails to defend its newly claimed floor and collapses back inside the base. A hard stop loss should be placed safely below the rising weekly 20 SMA and the mid-curve structural pivots, specifically around the 610.00 to 630.00 level. A definitive weekly close completely back below 600 would act as a severe warning sign of a failed macro breakout and a major bull trap.
5. Time Horizon:
Because this technical setup is engineered on a 1-Week chart capturing a massive structural phase transition and a clean multi-year rounding breakout, this is a longer-term position trade designed to capture a secular markup phase over the coming months and quarters. Let the macro trend run!
トレード稼働中
After successfull breakout price is consolidating
免責事項
これらの情報および投稿は、TradingViewが提供または承認する金融、投資、取引、またはその他の種類の助言もしくは推奨であることを意図したものではなく、またこれらに該当するものでもありません。詳細は利用規約をご覧ください。
免責事項
これらの情報および投稿は、TradingViewが提供または承認する金融、投資、取引、またはその他の種類の助言もしくは推奨であることを意図したものではなく、またこれらに該当するものでもありません。詳細は利用規約をご覧ください。