
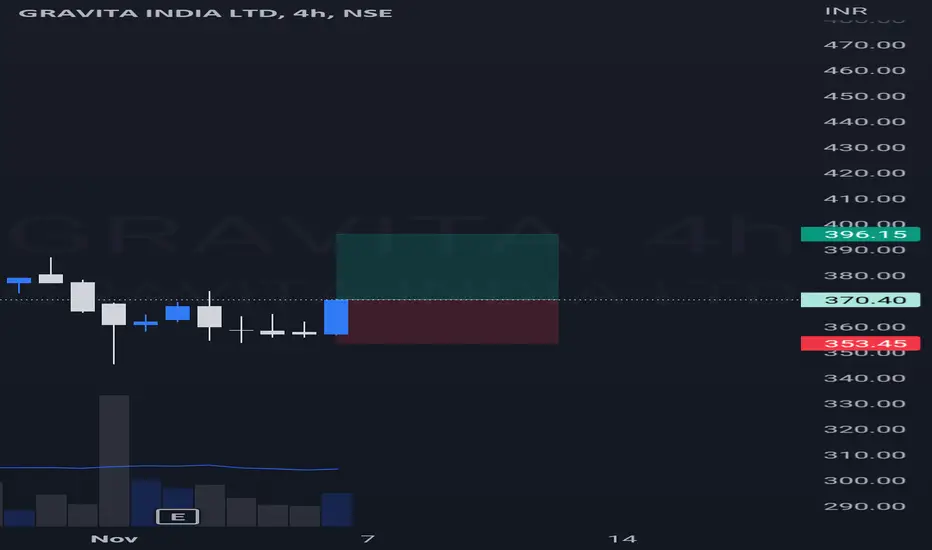
As per the 4h chart the bullish candle in devloped at the support levels.
The RS indicating positive.
The RSI also indicating good strenght.
The Break out in smaller time frame.
The price at Moving avrage Support.
Entry : 371
SL : below 353
T1 : 396
T2 : 421
The RS indicating positive.
The RSI also indicating good strenght.
The Break out in smaller time frame.
The price at Moving avrage Support.
Entry : 371
SL : below 353
T1 : 396
T2 : 421

免責事項
これらの情報および投稿は、TradingViewが提供または承認する金融、投資、取引、またはその他の種類の助言もしくは推奨であることを意図したものではなく、またこれらに該当するものでもありません。詳細は利用規約をご覧ください。
免責事項
これらの情報および投稿は、TradingViewが提供または承認する金融、投資、取引、またはその他の種類の助言もしくは推奨であることを意図したものではなく、またこれらに該当するものでもありません。詳細は利用規約をご覧ください。