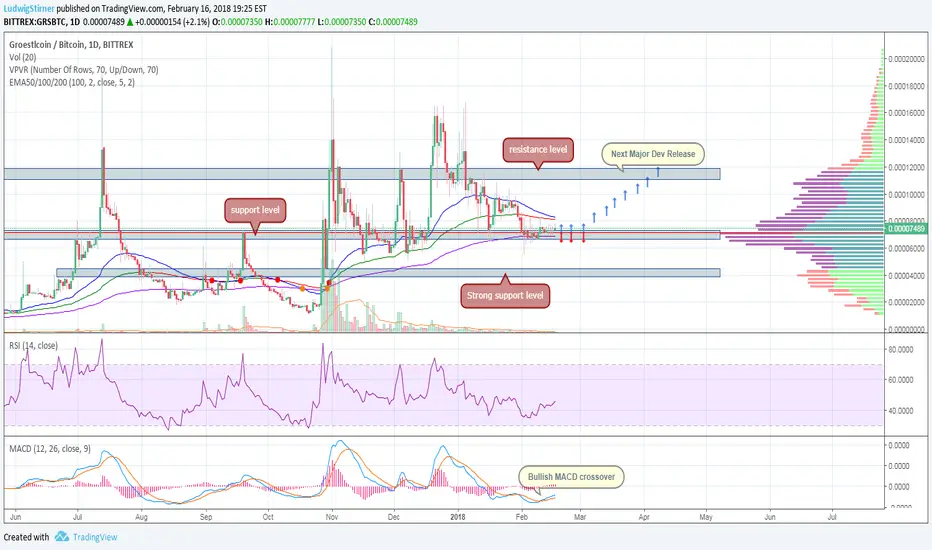
Moreover, the downside pressure seems to be weakening, while the technical indicators are endorsing the bullish scenario. From the technical point of view, in the short-term timeframe, the MACD indicator is approaching the positive bullish crossover, while the RSI is moving slightly higher above the oversold zone. Also, the price has just hit the 200-Day EMA near 6k Sats.
Further gains could see the resistance barrier, which overlaps with the 50-Day and 100-Day EMA. A jump above the aforementioned obstacle could reinforce the bullish structure in the short-term and open the way towards the next key resistance at 10k Sats.
Further gains could see the resistance barrier, which overlaps with the 50-Day and 100-Day EMA. A jump above the aforementioned obstacle could reinforce the bullish structure in the short-term and open the way towards the next key resistance at 10k Sats.

免責事項
これらの情報および投稿は、TradingViewが提供または承認する金融、投資、取引、またはその他の種類の助言もしくは推奨であることを意図したものではなく、またこれらに該当するものでもありません。詳細は利用規約をご覧ください。
免責事項
これらの情報および投稿は、TradingViewが提供または承認する金融、投資、取引、またはその他の種類の助言もしくは推奨であることを意図したものではなく、またこれらに該当するものでもありません。詳細は利用規約をご覧ください。