The Graph / Bitcoin
Hello!
Here we have Grt/Btc once again.
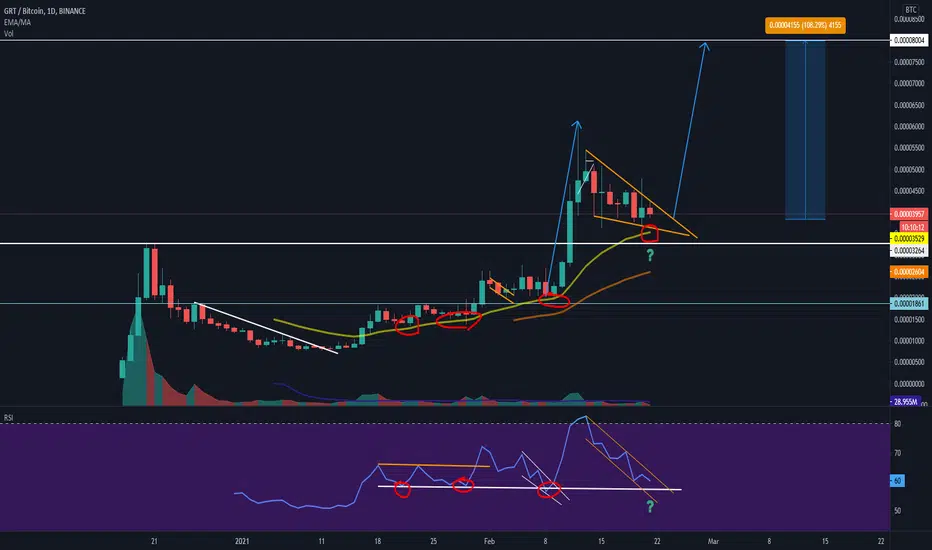
We can see from RSI vertical support line the 20 EMA bounces marked as red
Fourth time a charm or break downwards?
On RSI we can see similar price action like we did on previous break.
The Graph did come out on 17th of December 2020 but they have been working and helping others in the field much longer than that.
If you don't know the project I suggest to check it out.
I did make a analysis about the project already in January 26th
If you do take trades and are not holding for long term use stop loss.
Otherwise you will get your ass burned!
Jebu

関連の投稿
免責事項
これらの情報および投稿は、TradingViewが提供または承認する金融、投資、取引、またはその他の種類の助言もしくは推奨であることを意図したものではなく、またこれらに該当するものでもありません。詳細は利用規約をご覧ください。
関連の投稿
免責事項
これらの情報および投稿は、TradingViewが提供または承認する金融、投資、取引、またはその他の種類の助言もしくは推奨であることを意図したものではなく、またこれらに該当するものでもありません。詳細は利用規約をご覧ください。