
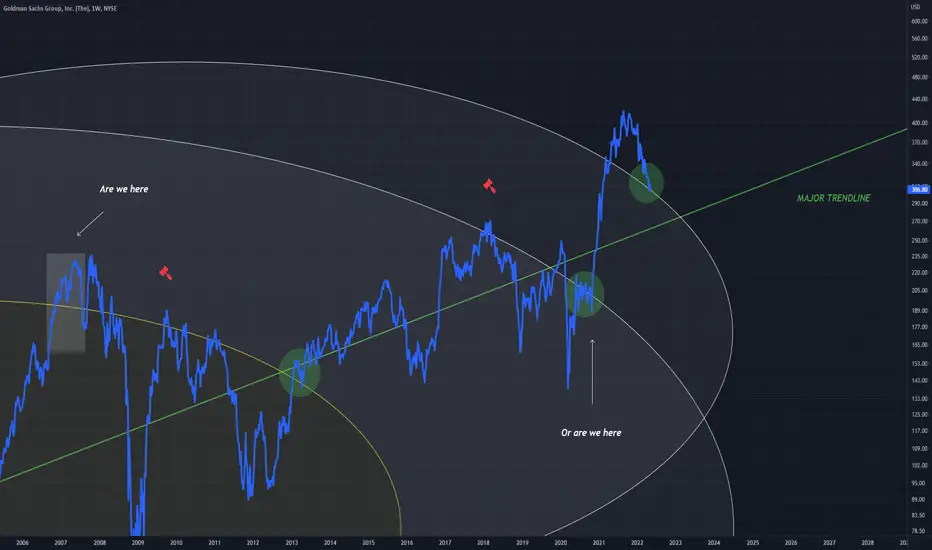
There are two positions we are either in
The white rectangle which is the beginning of a rejection pattern along the circle, or a green circle which is a bullish pattern that finds support on the circle
I am leaning more towards the green circle position (bullish state) due to the position price being quite highly above the circle and it is more comparable to the green circle on the yellow fib ring
Being above the green trend line adds to this bullish assumption
This is the Weekly chart for GS (Goldman Sachs)
The white rectangle which is the beginning of a rejection pattern along the circle, or a green circle which is a bullish pattern that finds support on the circle
I am leaning more towards the green circle position (bullish state) due to the position price being quite highly above the circle and it is more comparable to the green circle on the yellow fib ring
Being above the green trend line adds to this bullish assumption
This is the Weekly chart for GS (Goldman Sachs)

免責事項
これらの情報および投稿は、TradingViewが提供または承認する金融、投資、取引、またはその他の種類の助言もしくは推奨であることを意図したものではなく、またこれらに該当するものでもありません。詳細は利用規約をご覧ください。
免責事項
これらの情報および投稿は、TradingViewが提供または承認する金融、投資、取引、またはその他の種類の助言もしくは推奨であることを意図したものではなく、またこれらに該当するものでもありません。詳細は利用規約をご覧ください。