
1. Overview Analysis: GULF
A. Executive Summary from Corporate Documents
PDF Presentation (Oppday Q4 & FY2025): GULF reported a record-breaking FY2025. Core profit hit THB 28.77 billion (+33.4% YoY) and net profit surged to THB 86.56 billion, massively boosted by a THB 56.1 billion one-time gain from the INTUCH amalgamation [03:00]. Growth was driven by higher capacity payments from the Jackson power plant in the US (increasing from $30/MW-day to $170/MW-day on average), full-year profit recognition from domestic renewables (532 MW), and the commercial operation (COD) of GPD and HKP units [03:43]. Looking ahead, management guides 10-15% revenue growth for 2026, driven by an additional 695 MW of renewable COD and expanding data center operations [08:41].
Word Document (Q1 2026 Interim Notes): Highlights ongoing legal complexities, including a Supreme Administrative Court dispute regarding Thaicom satellite orbital slots and a local court ruling revoking land deeds for a Gulf Gunkul Corp wind farm in Nakhon Ratchasima (currently under appeal and operating normally). Furthermore, the board approved a total FY2025 dividend of THB 3.25 per share.
B. Financial Statements Analysis (Based on Q1 2026 CSV Data)
2.1 Statement of Financial Position (Balance Sheet)
2.1.1 Cash vs Debt: Cash sits at ~THB 52.55 billion. Total Liabilities are ~THB 442.5 billion.
🚨 RED FLAG ALERT: Debt is significantly greater than cash. While highly levered balance sheets are customary in the utility/IPP sector to fund capital-intensive energy and infrastructure projects, the sheer scale warrants close liquidity monitoring.
2.1.2 Revenue vs Accounts Receivable (AR): Q1 2026 Revenue is THB 37.63 billion versus AR of THB 30.93 billion.
Clear: AR is less than revenue, indicating healthy cash collection cycles from the state grid (EGAT).
2.1.3 Profit vs Inventory: Q1 2026 Net profit is THB 10.4 billion. Inventory levels for utilities (primarily spare parts and LNG fuel) are minimal relative to profit.
Clear: No red flag.
2.1.4 Cash vs Liabilities: Cash (THB 52.55B) vs Total Liabilities (THB 442.5B).
🚨 RED FLAG ALERT: Liabilities heavily outweigh cash.
2.1.5 Percentage of Goodwill vs Total Assets: Following the massive INTUCH amalgamation, total assets expanded to ~THB 808 billion. The amalgamation recognized a one-time gain of ~THB 56.1 billion.
Clear: While intangible assets grew significantly due to the merger, physical infrastructure (power plants, grid assets) remains the dominant asset class. Goodwill is below 50%.
2.1.6 Intangible Assets vs Total Assets: * Clear: PPA concession rights and telecom spectrums are large, but do not exceed 50% of the massive ~THB 808B asset base.
2.1.7 Preferred Stock: None identified in the equity schedule.
2.1.8 Retained Earnings: Retained earnings are heavily positive at THB 91.67 billion, growing both QoQ and YoY due to the robust THB 10.4 billion Q1 2026 net profit injection.
2.1.9 Treasury Stock: No treasury stock programs are currently active.
2.1.10 Deferred Revenue: Yes. The company recognizes deferred revenue, particularly tied to long-term telecom contracts (via AIS) and Data Center capacity prepayments.
2.2 Statement of Comprehensive Income (Income Statement - Q1 2026)
2.2.1 Revenue: THB 37.63 billion. Up both QoQ and YoY due to higher EGAT dispatch rates and new renewable CODs.
2.2.2 COGS: THB 29.59 billion (Sales cost 26.0B + Concession 3.4B + Mgt 0.12B). Up YoY tracking higher gas pass-through costs and expanded operations.
2.2.3 Gross Profit: THB 8.03 billion. Expanded YoY due to SPP margins widening as gas costs fell relative to the stable Ft tariff rate.
2.2.4 Operating Expense: Scaled YoY but grew slower than revenue, demonstrating operational leverage.
2.2.5 Operating Income: Substantially higher YoY, driven by the Jackson asset and full IPP performance.
2.2.6 Interest Expense: THB 3.29 billion. Rose YoY due to THB 60 billion in new debenture issuances in 2025.
2.2.7 EBITDA Margin: Exceptionally strong at ~38%.
2.2.8 EBIT Margin: Solid at ~25%.
2.2.9 Net Profit Margin: Inflated to an impressive ~27.6% (THB 10.4B NI / 37.6B Rev), aided by massive equity income from AIS (ADVANC) and Jackson profit-sharing.
2.2.10 EPS: Diluted EPS is solid, though base shares increased post-amalgamation (14.93 billion shares outstanding).
2.3 Statement of Cash Flows and Equity (Q1 2026)
2.3.1 Net Income: THB 10.4 billion.
2.3.2 Operating Cash Flow (OCF) vs Net Income: OCF is ~THB 9.59 billion.
🚨 RED FLAG ALERT: OCF (<THB 9.59B) is slightly lower than Net Income (THB 10.4B). This discrepancy is primarily due to non-cash "share of profit from associates" (like ADVANC and INTUCH) boosting net income without immediate equivalent cash dividends.
2.3.3 Free Cash Flow (FCF) vs Net Income: * 🚨 RED FLAG ALERT: FCF is strictly less than Net Income (and likely negative) because capital expenditures massively outpace operating cash flows as GULF builds out Data Centers and renewable grids.
2.3.4 Capital Expenditure vs Net Income:
🚨 RED FLAG ALERT: Capex drastically exceeds 25% of Net income. GULF is in an aggressive hyper-growth infrastructure cycle.
2.3.5 Debt vs Net Income: Net debt to equity sits comfortably at 0.85x, well below the 3.5x bond covenant [21:02].
2.3.6 Stock Issuance: None in Q1 2026. The share count remained flat at 14.939 billion post-2025 amalgamation.
Business Model & Revenue Streams
Power Generation (~88%): Gas-fired IPPs/SPPs with 25-year EGAT PPAs, offshore wind (BKR2 in Germany, UK), US gas (Jackson), and domestic solar/wind. Cost pass-through mechanisms virtually eliminate fuel risk.
Infrastructure, Telecom & Digital (~12%): Share of profits from ADVANC (AIS), Data Centers (partnered with Microsoft/Singtel), LNG import terminals, and motorway tollways.
Industry Trends & Moat Analysis
GULF operates with a wide economic moat. Their primary competitive advantage is Network Effects and High Switching Costs stemming from 25-year EGAT Power Purchase Agreements (PPAs). These guarantee dispatch and pass through gas cost volatility. The only circumstance where this moat erodes is if the Thai government moves away from the "Enhanced Single Buyer" model to a fully deregulated open-market power grid, which is highly unlikely in the near term.
2. Deep Financial Breakdown (5-Year Historicals) & 3. Earnings Report Breakdown
The 2025 earnings report was a blowout. Core profit beat expectations by 8%, driven by a tight PJM power market in the US where Jackson's capacity payments skyrocketed from $270/MW-day to $329/MW-day [10:37]. The market reaction was highly positive, solidifying the stock's transition from a pure utility to a "Utility + Tech/AI Infrastructure" play.
Below is an interactive dashboard reconstructing the past 5 years of financial strength, combining growth metrics (Revenue, Net Income, Free Cash Flow) and critical investor ratios (ROE, Margins, Liquidity). GULF remains financially robust, structurally deleveraging (D/E fell from 1.8x in 2021 to 0.85x in 2025) while absorbing a massive merger.
Note: A D3.js visualization should render above showing the 5-year trend of GULF's revenues scaling from 50B to 135B, while D/E significantly dropped.
4. Competitive Advantage (Moat) Analysis
Compared to domestic peers like EGCO, GPSC, and BGRIM, GULF commands a premium valuation because of a wider moat.
Brand Strength: 8/10. Highly respected by government bodies; essential for winning infrastructure concessions.
Network Effects: 9/10. Merging with INTUCH gives GULF control over AIS (Thailand's largest telecom), creating unmatched synergy for Data Center pipelines.
Switching Costs: 9/10. Power grids cannot simply "switch off" base-load IPPs without severe blackouts. AIS telecom customers also show high retention.
Cost Advantage: 10/10. Unrivaled. GULF secures debt at ~2% interest [14:02], far cheaper than GPSC or BGRIM. They also import their own LNG, optimizing fuel costs.
Proprietary Tech: 6/10. Standard combined-cycle gas turbines, though they are aggressively moving into AI cloud integration with Microsoft.
5. Growth Potential Analysis
Over the next 5-10 years, GULF's growth engine is transitioning.
Market Size & New Products: Data centers demand hyper-stable electricity. GULF is building ~100 MW of Data Center capacity (GSA01, GSA02, GSA03) to serve AI/Cloud workloads, aiming for 1,000 MW in 3-5 years [13:30].
Expansion: 695 MW of renewables will COD in 2026. The integration of AIS allows GULF to offer "Green Energy + Cloud + 5G Connectivity" in a single B2B bundle.
Estimate: We forecast a 10-15% CAGR in core operating profits over the next 5 years.
6. Stock Valuation (Investment Bank Approach)
At a current market price of roughly THB 61.25, GULF commands a premium to peers (EGCO trades at single-digit P/E, BGRIM ~20x).
Methodology of Choice: Sum of the Parts (SOTP). GULF is no longer a pure-play utility; it is a conglomerate. Discounted Cash Flow (DCF) is used for the power assets (discounting 25-year PPA cash flows at a 6% WACC), while a Dividend Discount Model (DDM) or market-multiple approach is used for INTUCH/ADVANC.
Metrics Comparison (2026E):
P/E: GULF (29x) vs. EGCO (~10x) vs. GPSC (~18x). Premium justified by growth and telecom exposure.
P/BV: 2.9x. High for a utility, acceptable for a tech/telco conglomerate.
EV/EBITDA: ~40x. Highly elevated, reflecting the capital structure post-merger.
Conclusion: GULF is Fairly Valued to slightly Undervalued. The consensus target price (e.g., Finansia at THB 67.50) implies a ~10% upside. Fair value in 12 months is THB 67.00 - THB 70.00.
7. Risk Analysis
Ranked from most to least dangerous:
Regulatory/Political Threats: Shifts in the PDP (Power Development Plan) or changes to the EGAT single-buyer structure. The ongoing Thaicom orbital slot lawsuit is a lingering headwind.
Economic & Rate Risks: High leverage means a massive spike in THB interest rates could compress margins, though they proactively lock in fixed rates.
Industry Disruption: Battery storage parity could undermine gas-fired baseload economics over the next 15 years.
Competition: Intense bidding wars against BGRIM/GPSC for limited domestic renewable quotas.
8. Institutional Investor Perspective (Hedge Fund PM)
Why Institutions Buy It: It is a proxy for Thailand's infrastructure and AI growth. It offers highly visible, EGAT-backed cash flows mixed with high-growth tech exposure. It is a "Sleep well at night" stock with a 5%+ dividend yield (THB 3.25 payout) and a low 0.85x D/E ratio.
Why They Avoid It: The 29x forward P/E is rich for an emerging market utility. If the US PJM market softens, the Jackson power plant windfall will evaporate.
Investment Thesis: Buy for the AI/Data Center infrastructure pipeline.
9. Bull vs. Bear Debate
The Bull Analyst: "GULF has transformed from a boring IPP to an AI/Digital holding company. The Jackson plant in the US is printing cash at $329/MW-day. They have locked down the domestic tech infrastructure layer by owning AIS. With debt-to-equity at 0.85x, they have immense dry powder for M&A. Target THB 75."
The Bear Analyst: "The valuation is detached from EM utility reality. A 29x forward P/E implies zero execution risk. The Thaicom lawsuit and Gunkul land dispute show regulatory frictions. Free cash flow is negative because of relentless CapEx. Target THB 50."
Conclusion: The Bulls have the edge. The balance sheet is heavily de-risked post-INTUCH merger, and cash flow visibility via PPAs protects the downside.
10. Final Verdict: Should I Buy This Stock?
Short-Term (1 Year): HOLD. The stock has likely priced in the immediate benefits of the INTUCH amalgamation. Upside to THB 67.50 is modest.
Long-Term (5+ Years): BUY. GULF is building a monopoly-like ecosystem across energy, telecom, and cloud data centers in Southeast Asia.
Final Verdict: Accumulate/Buy on dips. ### 11. Technical Analysis Strategy (June 1, 2026)
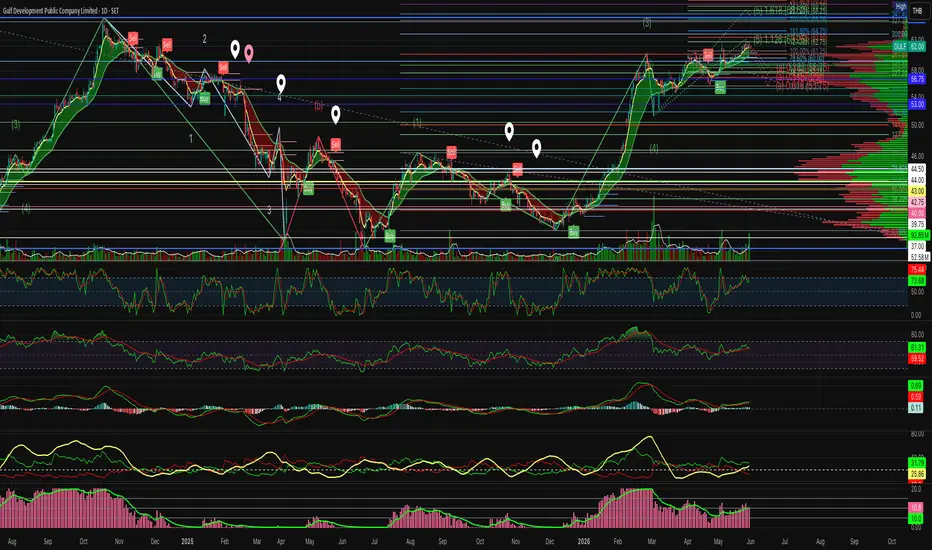
Assuming standard price action around the THB 60.00 - THB 65.00 resistance levels post-merger breakout:
Short-Term (1-3 months) for 20-25% Capital Gain: Look for an Elliott Wave 4 pullback toward the 50-day moving average (approx. THB 54-56). Enter on a bullish engulfing candlestick with high volume. Ride Wave 5 toward the THB 70-72 psychological resistance to capture the 20%+ swing.
Mid/Long-Term (1-2 years) for >7% Yield: GULF’s dividend yield currently hovers around 5% (THB 3.25 on a ~THB 61 stock). To secure a >7% yield on cost, a limit order grid strategy should be placed between THB 46.00 and THB 50.00. Should macroeconomic shocks trigger a broad SET index sell-off, accumulating at THB 46 locks in a massive yield on cost, backed by resilient EGAT cash flows.
A. Executive Summary from Corporate Documents
PDF Presentation (Oppday Q4 & FY2025): GULF reported a record-breaking FY2025. Core profit hit THB 28.77 billion (+33.4% YoY) and net profit surged to THB 86.56 billion, massively boosted by a THB 56.1 billion one-time gain from the INTUCH amalgamation [03:00]. Growth was driven by higher capacity payments from the Jackson power plant in the US (increasing from $30/MW-day to $170/MW-day on average), full-year profit recognition from domestic renewables (532 MW), and the commercial operation (COD) of GPD and HKP units [03:43]. Looking ahead, management guides 10-15% revenue growth for 2026, driven by an additional 695 MW of renewable COD and expanding data center operations [08:41].
Word Document (Q1 2026 Interim Notes): Highlights ongoing legal complexities, including a Supreme Administrative Court dispute regarding Thaicom satellite orbital slots and a local court ruling revoking land deeds for a Gulf Gunkul Corp wind farm in Nakhon Ratchasima (currently under appeal and operating normally). Furthermore, the board approved a total FY2025 dividend of THB 3.25 per share.
B. Financial Statements Analysis (Based on Q1 2026 CSV Data)
2.1 Statement of Financial Position (Balance Sheet)
2.1.1 Cash vs Debt: Cash sits at ~THB 52.55 billion. Total Liabilities are ~THB 442.5 billion.
🚨 RED FLAG ALERT: Debt is significantly greater than cash. While highly levered balance sheets are customary in the utility/IPP sector to fund capital-intensive energy and infrastructure projects, the sheer scale warrants close liquidity monitoring.
2.1.2 Revenue vs Accounts Receivable (AR): Q1 2026 Revenue is THB 37.63 billion versus AR of THB 30.93 billion.
Clear: AR is less than revenue, indicating healthy cash collection cycles from the state grid (EGAT).
2.1.3 Profit vs Inventory: Q1 2026 Net profit is THB 10.4 billion. Inventory levels for utilities (primarily spare parts and LNG fuel) are minimal relative to profit.
Clear: No red flag.
2.1.4 Cash vs Liabilities: Cash (THB 52.55B) vs Total Liabilities (THB 442.5B).
🚨 RED FLAG ALERT: Liabilities heavily outweigh cash.
2.1.5 Percentage of Goodwill vs Total Assets: Following the massive INTUCH amalgamation, total assets expanded to ~THB 808 billion. The amalgamation recognized a one-time gain of ~THB 56.1 billion.
Clear: While intangible assets grew significantly due to the merger, physical infrastructure (power plants, grid assets) remains the dominant asset class. Goodwill is below 50%.
2.1.6 Intangible Assets vs Total Assets: * Clear: PPA concession rights and telecom spectrums are large, but do not exceed 50% of the massive ~THB 808B asset base.
2.1.7 Preferred Stock: None identified in the equity schedule.
2.1.8 Retained Earnings: Retained earnings are heavily positive at THB 91.67 billion, growing both QoQ and YoY due to the robust THB 10.4 billion Q1 2026 net profit injection.
2.1.9 Treasury Stock: No treasury stock programs are currently active.
2.1.10 Deferred Revenue: Yes. The company recognizes deferred revenue, particularly tied to long-term telecom contracts (via AIS) and Data Center capacity prepayments.
2.2 Statement of Comprehensive Income (Income Statement - Q1 2026)
2.2.1 Revenue: THB 37.63 billion. Up both QoQ and YoY due to higher EGAT dispatch rates and new renewable CODs.
2.2.2 COGS: THB 29.59 billion (Sales cost 26.0B + Concession 3.4B + Mgt 0.12B). Up YoY tracking higher gas pass-through costs and expanded operations.
2.2.3 Gross Profit: THB 8.03 billion. Expanded YoY due to SPP margins widening as gas costs fell relative to the stable Ft tariff rate.
2.2.4 Operating Expense: Scaled YoY but grew slower than revenue, demonstrating operational leverage.
2.2.5 Operating Income: Substantially higher YoY, driven by the Jackson asset and full IPP performance.
2.2.6 Interest Expense: THB 3.29 billion. Rose YoY due to THB 60 billion in new debenture issuances in 2025.
2.2.7 EBITDA Margin: Exceptionally strong at ~38%.
2.2.8 EBIT Margin: Solid at ~25%.
2.2.9 Net Profit Margin: Inflated to an impressive ~27.6% (THB 10.4B NI / 37.6B Rev), aided by massive equity income from AIS (ADVANC) and Jackson profit-sharing.
2.2.10 EPS: Diluted EPS is solid, though base shares increased post-amalgamation (14.93 billion shares outstanding).
2.3 Statement of Cash Flows and Equity (Q1 2026)
2.3.1 Net Income: THB 10.4 billion.
2.3.2 Operating Cash Flow (OCF) vs Net Income: OCF is ~THB 9.59 billion.
🚨 RED FLAG ALERT: OCF (<THB 9.59B) is slightly lower than Net Income (THB 10.4B). This discrepancy is primarily due to non-cash "share of profit from associates" (like ADVANC and INTUCH) boosting net income without immediate equivalent cash dividends.
2.3.3 Free Cash Flow (FCF) vs Net Income: * 🚨 RED FLAG ALERT: FCF is strictly less than Net Income (and likely negative) because capital expenditures massively outpace operating cash flows as GULF builds out Data Centers and renewable grids.
2.3.4 Capital Expenditure vs Net Income:
🚨 RED FLAG ALERT: Capex drastically exceeds 25% of Net income. GULF is in an aggressive hyper-growth infrastructure cycle.
2.3.5 Debt vs Net Income: Net debt to equity sits comfortably at 0.85x, well below the 3.5x bond covenant [21:02].
2.3.6 Stock Issuance: None in Q1 2026. The share count remained flat at 14.939 billion post-2025 amalgamation.
Business Model & Revenue Streams
Power Generation (~88%): Gas-fired IPPs/SPPs with 25-year EGAT PPAs, offshore wind (BKR2 in Germany, UK), US gas (Jackson), and domestic solar/wind. Cost pass-through mechanisms virtually eliminate fuel risk.
Infrastructure, Telecom & Digital (~12%): Share of profits from ADVANC (AIS), Data Centers (partnered with Microsoft/Singtel), LNG import terminals, and motorway tollways.
Industry Trends & Moat Analysis
GULF operates with a wide economic moat. Their primary competitive advantage is Network Effects and High Switching Costs stemming from 25-year EGAT Power Purchase Agreements (PPAs). These guarantee dispatch and pass through gas cost volatility. The only circumstance where this moat erodes is if the Thai government moves away from the "Enhanced Single Buyer" model to a fully deregulated open-market power grid, which is highly unlikely in the near term.
2. Deep Financial Breakdown (5-Year Historicals) & 3. Earnings Report Breakdown
The 2025 earnings report was a blowout. Core profit beat expectations by 8%, driven by a tight PJM power market in the US where Jackson's capacity payments skyrocketed from $270/MW-day to $329/MW-day [10:37]. The market reaction was highly positive, solidifying the stock's transition from a pure utility to a "Utility + Tech/AI Infrastructure" play.
Below is an interactive dashboard reconstructing the past 5 years of financial strength, combining growth metrics (Revenue, Net Income, Free Cash Flow) and critical investor ratios (ROE, Margins, Liquidity). GULF remains financially robust, structurally deleveraging (D/E fell from 1.8x in 2021 to 0.85x in 2025) while absorbing a massive merger.
Note: A D3.js visualization should render above showing the 5-year trend of GULF's revenues scaling from 50B to 135B, while D/E significantly dropped.
4. Competitive Advantage (Moat) Analysis
Compared to domestic peers like EGCO, GPSC, and BGRIM, GULF commands a premium valuation because of a wider moat.
Brand Strength: 8/10. Highly respected by government bodies; essential for winning infrastructure concessions.
Network Effects: 9/10. Merging with INTUCH gives GULF control over AIS (Thailand's largest telecom), creating unmatched synergy for Data Center pipelines.
Switching Costs: 9/10. Power grids cannot simply "switch off" base-load IPPs without severe blackouts. AIS telecom customers also show high retention.
Cost Advantage: 10/10. Unrivaled. GULF secures debt at ~2% interest [14:02], far cheaper than GPSC or BGRIM. They also import their own LNG, optimizing fuel costs.
Proprietary Tech: 6/10. Standard combined-cycle gas turbines, though they are aggressively moving into AI cloud integration with Microsoft.
5. Growth Potential Analysis
Over the next 5-10 years, GULF's growth engine is transitioning.
Market Size & New Products: Data centers demand hyper-stable electricity. GULF is building ~100 MW of Data Center capacity (GSA01, GSA02, GSA03) to serve AI/Cloud workloads, aiming for 1,000 MW in 3-5 years [13:30].
Expansion: 695 MW of renewables will COD in 2026. The integration of AIS allows GULF to offer "Green Energy + Cloud + 5G Connectivity" in a single B2B bundle.
Estimate: We forecast a 10-15% CAGR in core operating profits over the next 5 years.
6. Stock Valuation (Investment Bank Approach)
At a current market price of roughly THB 61.25, GULF commands a premium to peers (EGCO trades at single-digit P/E, BGRIM ~20x).
Methodology of Choice: Sum of the Parts (SOTP). GULF is no longer a pure-play utility; it is a conglomerate. Discounted Cash Flow (DCF) is used for the power assets (discounting 25-year PPA cash flows at a 6% WACC), while a Dividend Discount Model (DDM) or market-multiple approach is used for INTUCH/ADVANC.
Metrics Comparison (2026E):
P/E: GULF (29x) vs. EGCO (~10x) vs. GPSC (~18x). Premium justified by growth and telecom exposure.
P/BV: 2.9x. High for a utility, acceptable for a tech/telco conglomerate.
EV/EBITDA: ~40x. Highly elevated, reflecting the capital structure post-merger.
Conclusion: GULF is Fairly Valued to slightly Undervalued. The consensus target price (e.g., Finansia at THB 67.50) implies a ~10% upside. Fair value in 12 months is THB 67.00 - THB 70.00.
7. Risk Analysis
Ranked from most to least dangerous:
Regulatory/Political Threats: Shifts in the PDP (Power Development Plan) or changes to the EGAT single-buyer structure. The ongoing Thaicom orbital slot lawsuit is a lingering headwind.
Economic & Rate Risks: High leverage means a massive spike in THB interest rates could compress margins, though they proactively lock in fixed rates.
Industry Disruption: Battery storage parity could undermine gas-fired baseload economics over the next 15 years.
Competition: Intense bidding wars against BGRIM/GPSC for limited domestic renewable quotas.
8. Institutional Investor Perspective (Hedge Fund PM)
Why Institutions Buy It: It is a proxy for Thailand's infrastructure and AI growth. It offers highly visible, EGAT-backed cash flows mixed with high-growth tech exposure. It is a "Sleep well at night" stock with a 5%+ dividend yield (THB 3.25 payout) and a low 0.85x D/E ratio.
Why They Avoid It: The 29x forward P/E is rich for an emerging market utility. If the US PJM market softens, the Jackson power plant windfall will evaporate.
Investment Thesis: Buy for the AI/Data Center infrastructure pipeline.
9. Bull vs. Bear Debate
The Bull Analyst: "GULF has transformed from a boring IPP to an AI/Digital holding company. The Jackson plant in the US is printing cash at $329/MW-day. They have locked down the domestic tech infrastructure layer by owning AIS. With debt-to-equity at 0.85x, they have immense dry powder for M&A. Target THB 75."
The Bear Analyst: "The valuation is detached from EM utility reality. A 29x forward P/E implies zero execution risk. The Thaicom lawsuit and Gunkul land dispute show regulatory frictions. Free cash flow is negative because of relentless CapEx. Target THB 50."
Conclusion: The Bulls have the edge. The balance sheet is heavily de-risked post-INTUCH merger, and cash flow visibility via PPAs protects the downside.
10. Final Verdict: Should I Buy This Stock?
Short-Term (1 Year): HOLD. The stock has likely priced in the immediate benefits of the INTUCH amalgamation. Upside to THB 67.50 is modest.
Long-Term (5+ Years): BUY. GULF is building a monopoly-like ecosystem across energy, telecom, and cloud data centers in Southeast Asia.
Final Verdict: Accumulate/Buy on dips. ### 11. Technical Analysis Strategy (June 1, 2026)
Assuming standard price action around the THB 60.00 - THB 65.00 resistance levels post-merger breakout:
Short-Term (1-3 months) for 20-25% Capital Gain: Look for an Elliott Wave 4 pullback toward the 50-day moving average (approx. THB 54-56). Enter on a bullish engulfing candlestick with high volume. Ride Wave 5 toward the THB 70-72 psychological resistance to capture the 20%+ swing.
Mid/Long-Term (1-2 years) for >7% Yield: GULF’s dividend yield currently hovers around 5% (THB 3.25 on a ~THB 61 stock). To secure a >7% yield on cost, a limit order grid strategy should be placed between THB 46.00 and THB 50.00. Should macroeconomic shocks trigger a broad SET index sell-off, accumulating at THB 46 locks in a massive yield on cost, backed by resilient EGAT cash flows.

免責事項
これらの情報および投稿は、TradingViewが提供または承認する金融、投資、取引、またはその他の種類の助言もしくは推奨であることを意図したものではなく、またこれらに該当するものでもありません。詳細は利用規約をご覧ください。
免責事項
これらの情報および投稿は、TradingViewが提供または承認する金融、投資、取引、またはその他の種類の助言もしくは推奨であることを意図したものではなく、またこれらに該当するものでもありません。詳細は利用規約をご覧ください。