
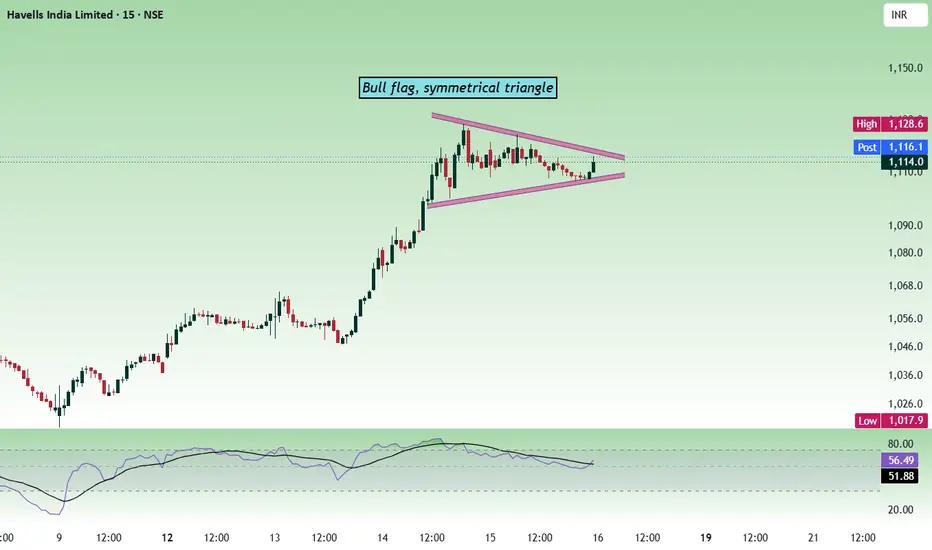
In the lower timeframe, the price is forming a symmetrical triangle. We can also see a bull flag formation. A symmetrical triangle is a neutral pattern, and the breakout can be in any direction. A bull flag is a bullish pattern.
On the daily timeframe, the price is forming a W pattern, which is bullish.

The price is bullish as long as it stays above 1082 - 1088.
Buy above 1110 - 1114 with a stop-loss of 1094 for the targets 1122, 1136, 1148, 1162 and 1176.
The price can face resistance at the 1130 zone, and sustaining above it is important to move up further.
Always do your analysis before taking any trade.
On the daily timeframe, the price is forming a W pattern, which is bullish.
The price is bullish as long as it stays above 1082 - 1088.
Buy above 1110 - 1114 with a stop-loss of 1094 for the targets 1122, 1136, 1148, 1162 and 1176.
The price can face resistance at the 1130 zone, and sustaining above it is important to move up further.
Always do your analysis before taking any trade.
トレード稼働中
T2 done. The price is having a pullback. 
Role I play here : Moderator. Follow me in telegram to trade better. t.me/Analysis4Newbie Contact information : tradingplan4u@gmail.com
免責事項
これらの情報および投稿は、TradingViewが提供または承認する金融、投資、取引、またはその他の種類の助言もしくは推奨であることを意図したものではなく、またこれらに該当するものでもありません。詳細は利用規約をご覧ください。
Role I play here : Moderator. Follow me in telegram to trade better. t.me/Analysis4Newbie Contact information : tradingplan4u@gmail.com
免責事項
これらの情報および投稿は、TradingViewが提供または承認する金融、投資、取引、またはその他の種類の助言もしくは推奨であることを意図したものではなく、またこれらに該当するものでもありません。詳細は利用規約をご覧ください。