
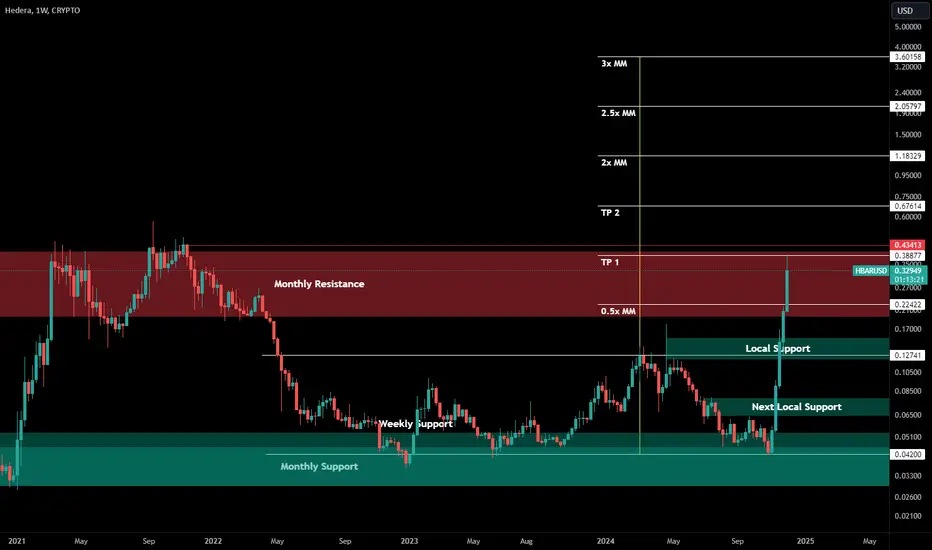
Publishing a monthly support and resistance chart, a weekly view of that chart - with targets - that I've been sharing for a while, so others can follow along.
This in addition to the parallel S/R chart that is already published here:

With an updated snapshot of it here (targets adjusted for where it broke out):

Possible areas of local support if any dips below monthly resistance are marked on the chart.
Hope this helps if you are following HBARUSD
This in addition to the parallel S/R chart that is already published here:
With an updated snapshot of it here (targets adjusted for where it broke out):
Possible areas of local support if any dips below monthly resistance are marked on the chart.
Hope this helps if you are following HBARUSD

免責事項
これらの情報および投稿は、TradingViewが提供または承認する金融、投資、取引、またはその他の種類の助言もしくは推奨であることを意図したものではなく、またこれらに該当するものでもありません。詳細は利用規約をご覧ください。
免責事項
これらの情報および投稿は、TradingViewが提供または承認する金融、投資、取引、またはその他の種類の助言もしくは推奨であることを意図したものではなく、またこれらに該当するものでもありません。詳細は利用規約をご覧ください。