
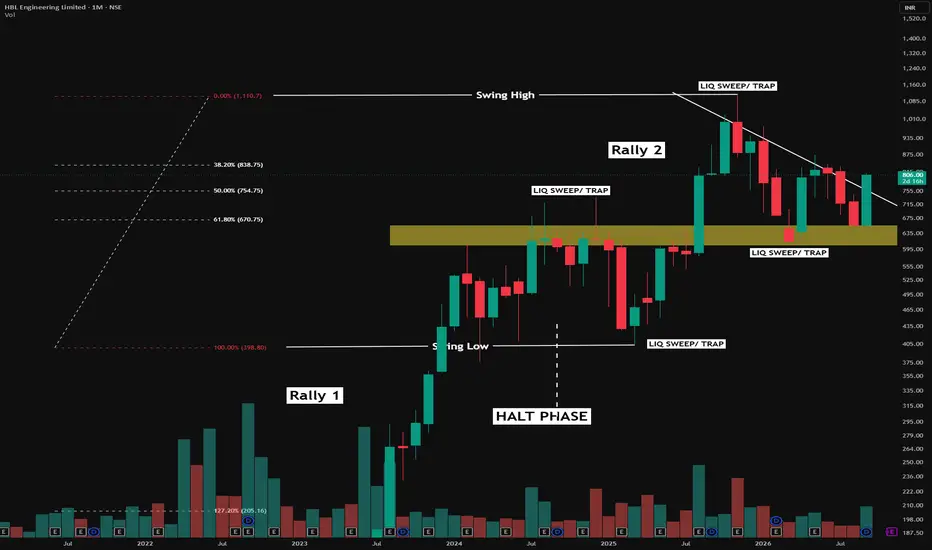
Historical chart older than three months, shared solely for educational purposes to explain market structure and technical-analysis concepts. No current market view or recommendation is being expressed.
When viewed candle by candle, markets can look complicated.
Zoom out to the monthly timeframe, and the structure can become surprisingly simple.Noiseless
This historical chart demonstrates a cycle I repeatedly study.
Rally 1: Price enters a strong expansion phase. As momentum builds, attention and FOMO often increase—but nobody knows in real time which candle will ultimately mark the peak.
Then comes what I call the Halt Phase.
Instead of continuing vertically, price spends an extended period moving sideways. Highs and lows are tested, failed moves occur, and liquidity develops on both sides of the range.
Eventually, a meaningful Swing Low is established. After the prolonged consolidation, price breaks out of the structure and enters Rally 2, expanding toward a new Swing High.
And then?
The process begins to rhyme again.
Momentum slows, price peaks, smaller-timeframe liquidity sweeps appear, and another consolidation phase begins to develop.
There is another important confluence on this chart.
Using Fibonacci from the major Swing Low to Swing High, the 61.8% retracement area aligns closely with the highlighted historical zone—a former resistance area that later acts as a support/demand reference.
That gives us multiple layers of structure in the same region:
Previous Resistance > Flip Zone > Fibonacci Confluence
The larger lesson isn't about predicting exactly where a rally starts or ends.
It is about understanding the rhythm of market structure:
Expansion > FOMO > Halt > Liquidity > Breakout > Expansion > Halt
When viewed candle by candle, markets can look complicated.
Zoom out to the monthly timeframe, and the structure can become surprisingly simple.Noiseless
This historical chart demonstrates a cycle I repeatedly study.
Rally 1: Price enters a strong expansion phase. As momentum builds, attention and FOMO often increase—but nobody knows in real time which candle will ultimately mark the peak.
Then comes what I call the Halt Phase.
Instead of continuing vertically, price spends an extended period moving sideways. Highs and lows are tested, failed moves occur, and liquidity develops on both sides of the range.
Eventually, a meaningful Swing Low is established. After the prolonged consolidation, price breaks out of the structure and enters Rally 2, expanding toward a new Swing High.
And then?
The process begins to rhyme again.
Momentum slows, price peaks, smaller-timeframe liquidity sweeps appear, and another consolidation phase begins to develop.
There is another important confluence on this chart.
Using Fibonacci from the major Swing Low to Swing High, the 61.8% retracement area aligns closely with the highlighted historical zone—a former resistance area that later acts as a support/demand reference.
That gives us multiple layers of structure in the same region:
Previous Resistance > Flip Zone > Fibonacci Confluence
The larger lesson isn't about predicting exactly where a rally starts or ends.
It is about understanding the rhythm of market structure:
Expansion > FOMO > Halt > Liquidity > Breakout > Expansion > Halt

📊Swing & positional research with Buy, Sell & Hold recommendations
Contact for NOVEMBER SLOTS
📞WhatsApp ( Pro ): wa.me/919455664601
📢Free Picks on Telegram ( Join ) : t.me/hashtaghammer
Apoorv Dubey|SEBI RA INH000030287
Contact for NOVEMBER SLOTS
📞WhatsApp ( Pro ): wa.me/919455664601
📢Free Picks on Telegram ( Join ) : t.me/hashtaghammer
Apoorv Dubey|SEBI RA INH000030287
関連の投稿
免責事項
これらの情報および投稿は、TradingViewが提供または承認する金融、投資、取引、またはその他の種類の助言もしくは推奨であることを意図したものではなく、またこれらに該当するものでもありません。詳細は利用規約をご覧ください。
📊Swing & positional research with Buy, Sell & Hold recommendations
Contact for NOVEMBER SLOTS
📞WhatsApp ( Pro ): wa.me/919455664601
📢Free Picks on Telegram ( Join ) : t.me/hashtaghammer
Apoorv Dubey|SEBI RA INH000030287
Contact for NOVEMBER SLOTS
📞WhatsApp ( Pro ): wa.me/919455664601
📢Free Picks on Telegram ( Join ) : t.me/hashtaghammer
Apoorv Dubey|SEBI RA INH000030287
関連の投稿
免責事項
これらの情報および投稿は、TradingViewが提供または承認する金融、投資、取引、またはその他の種類の助言もしくは推奨であることを意図したものではなく、またこれらに該当するものでもありません。詳細は利用規約をご覧ください。