
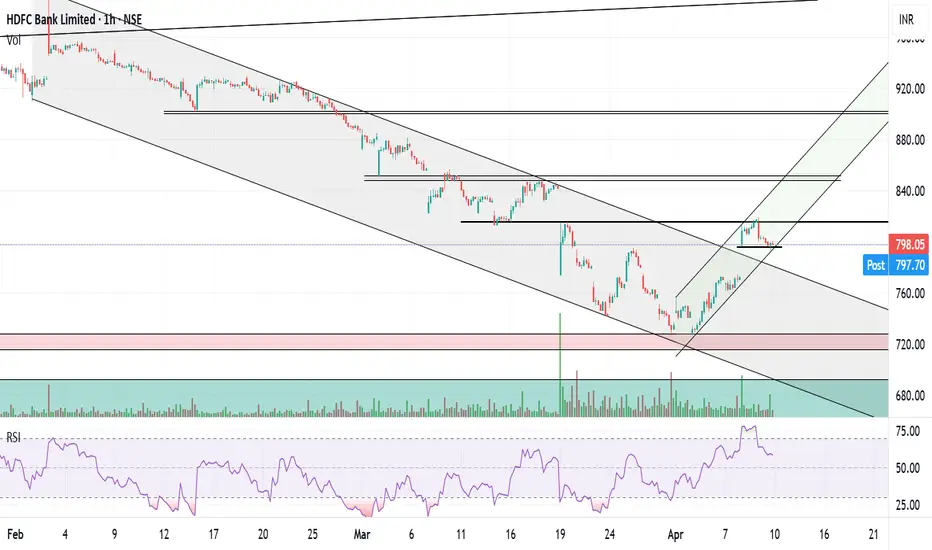
HDFCBANK was moving in a descending zone, but it has now moved out and is now in an ascending zone. in the last 1 hour candle a hammer has been clearly formed - confirming the zone. the volume in the last 1 hour candle -which was green - was also much higher than average hourly volume.
the formation is also similar to Cup & handle where the handle formation is expected
Target 1 - 2 trading days - 815
target 2- 4-5 trading days - 850
target 3 - if it holds above 850, then 900
Stoploss - 790
*this is a high conviction chart*
the formation is also similar to Cup & handle where the handle formation is expected
Target 1 - 2 trading days - 815
target 2- 4-5 trading days - 850
target 3 - if it holds above 850, then 900
Stoploss - 790
*this is a high conviction chart*

免責事項
これらの情報および投稿は、TradingViewが提供または承認する金融、投資、取引、またはその他の種類の助言もしくは推奨であることを意図したものではなく、またこれらに該当するものでもありません。詳細は利用規約をご覧ください。
免責事項
これらの情報および投稿は、TradingViewが提供または承認する金融、投資、取引、またはその他の種類の助言もしくは推奨であることを意図したものではなく、またこれらに該当するものでもありません。詳細は利用規約をご覧ください。