ロング
Current pivot analysis
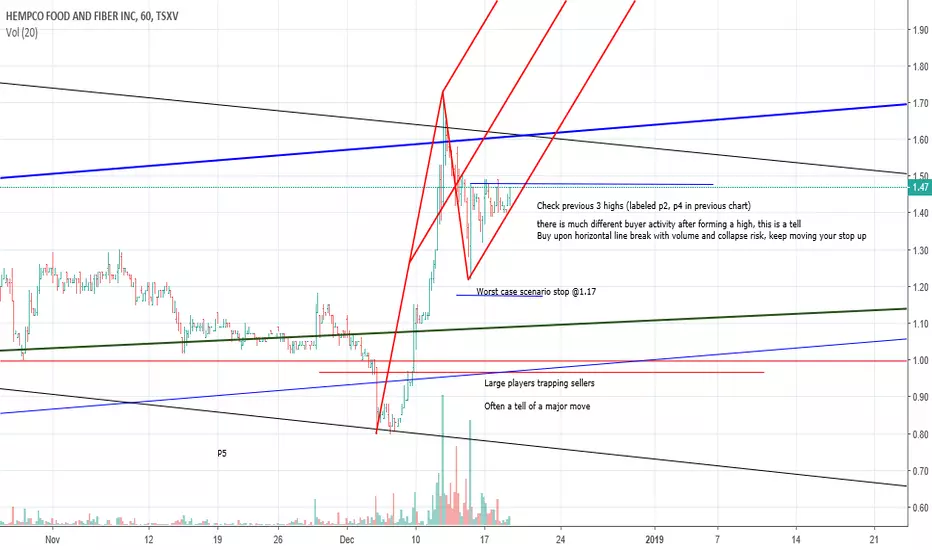
I tried to link my charts to my previous posts however it did not work, I am not very familiar with this site yet.
take a look at the 2 previous pivots I labeled P2 and P4 near the high of the range, does not take a rocket scientist to see the change in behaviour.
Enter upon a break of horizontal line with volume with a worst case scenario stop at 1.17 THAT YOU CAN AFFORD.
Only enter with increased volume, if market breaks back into range get out.
and whatever you do don't enter until it breaks with volume, short sellers could still win
take a look at the 2 previous pivots I labeled P2 and P4 near the high of the range, does not take a rocket scientist to see the change in behaviour.
Enter upon a break of horizontal line with volume with a worst case scenario stop at 1.17 THAT YOU CAN AFFORD.
Only enter with increased volume, if market breaks back into range get out.
and whatever you do don't enter until it breaks with volume, short sellers could still win

関連の投稿
免責事項
これらの情報および投稿は、TradingViewが提供または承認する金融、投資、取引、またはその他の種類の助言もしくは推奨であることを意図したものではなく、またこれらに該当するものでもありません。詳細は利用規約をご覧ください。
免責事項
これらの情報および投稿は、TradingViewが提供または承認する金融、投資、取引、またはその他の種類の助言もしくは推奨であることを意図したものではなく、またこれらに該当するものでもありません。詳細は利用規約をご覧ください。