
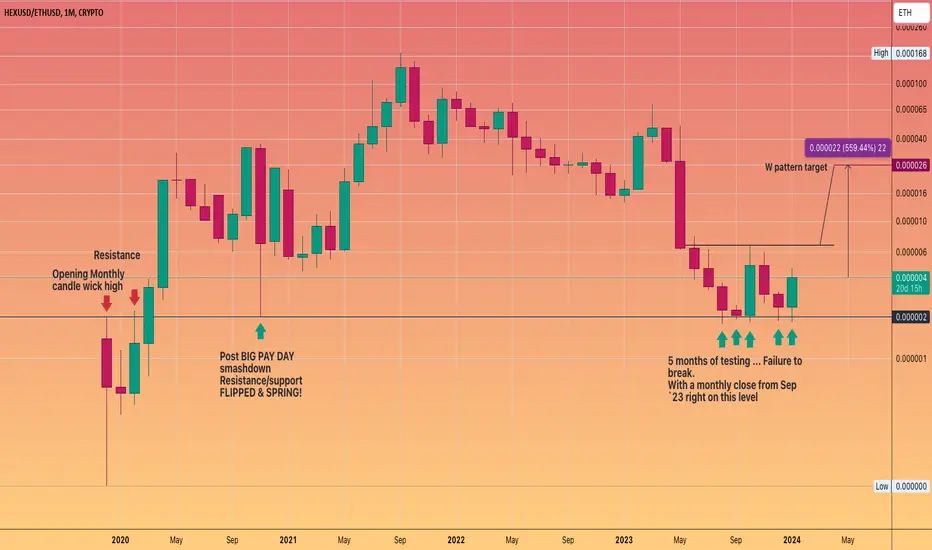
A great study of a Key level / ratio
Key levels on charts are where significant price action occurs over the course of time.
For the HEXETH chart 0.000002 has proven one of the most interesting and pivotal for sure.
If we had of broken down these past 5/6 months
Then it could be argued it would be signalling an abandonment of this project ( at the least on the ethereum side)
but the continual support and wick action indicated footsteps of big players coming and seeing it as a value zone.
This could be a nice spring for this ratio going forward. With a W formation also appearing to be forming.
Best of luck in your speculations.
ノート
Another -74% to go!!!
As eHEX looks to complete it's roundtrip v ETH
That would equal $0.00044615 at current eth prices
so this ratio could even drop below that!!
All the Ethereum backing eHEX is in the hands of Richard
Hexicans will be praying that turbo pump pHEX at one point
but to what use...
it would just be for ppl to exit at 10,15,20 cents
and also would require alot of monetary firepower.
Basically pHEX is a dead man walking also..
トレード稼働中
#HEX v #ETHトレード終了: ストップロスに到達
Closing this chapter.The original thesis was wrong. The key #HEX/#ETH support eventually failed and the ratio continued substantially lower.
I was heavily involved in the HEX/PulseChain community at the time, so I've followed this story through both the extraordinary highs and the brutal lows.
Much has changed since this idea was published. Rather than rewrite the original thesis with hindsight, I'm closing it here and preserving the chart as it was.
There may, however, finally be signs of a long-term base forming. I've included a fresh weekly chart showing where the ratio stands today.
Old thesis closed. New cycle deserves a new chart.

免責事項
これらの情報および投稿は、TradingViewが提供または承認する金融、投資、取引、またはその他の種類の助言もしくは推奨であることを意図したものではなく、またこれらに該当するものでもありません。詳細は利用規約をご覧ください。
免責事項
これらの情報および投稿は、TradingViewが提供または承認する金融、投資、取引、またはその他の種類の助言もしくは推奨であることを意図したものではなく、またこれらに該当するものでもありません。詳細は利用規約をご覧ください。