
Technical:
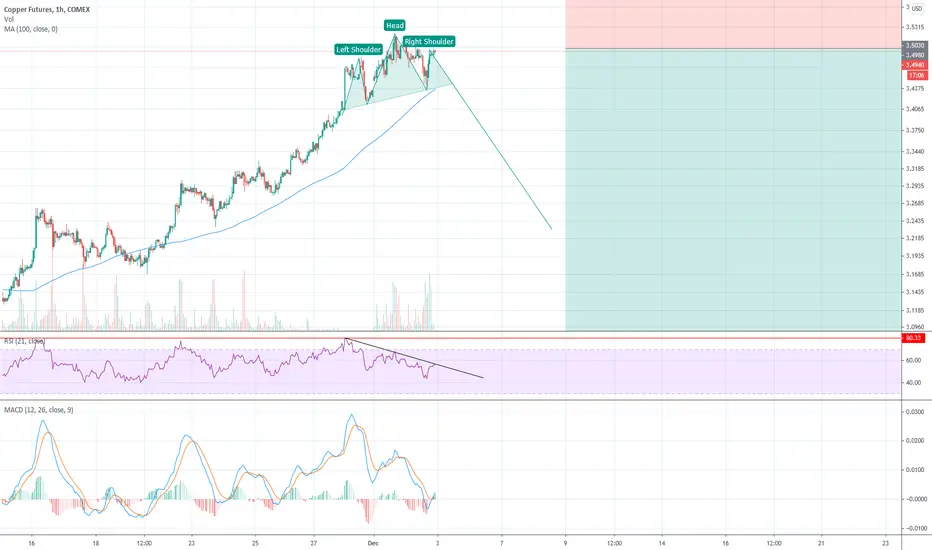
An hour precision chart indicates possible head and shoulder formation, negative RSI. Day precision chart indicates RSI almost at its 80s and if a divergence is to be build somewhere there is a high chance it is here.
Fundamental:
Low stockpile of copper in China has inspired a rally but at this level of stockpile ALWAYS in the past we have seen a move that rebuilds it fast within a month.
Take profit 2.5
It would be great to see gold retest 1850 from bottom and then all commodities could initiate a simultaneous correction. In the long term commodities (obviously not all of them) can only rise.
An hour precision chart indicates possible head and shoulder formation, negative RSI. Day precision chart indicates RSI almost at its 80s and if a divergence is to be build somewhere there is a high chance it is here.
Fundamental:
Low stockpile of copper in China has inspired a rally but at this level of stockpile ALWAYS in the past we have seen a move that rebuilds it fast within a month.
Take profit 2.5
It would be great to see gold retest 1850 from bottom and then all commodities could initiate a simultaneous correction. In the long term commodities (obviously not all of them) can only rise.

免責事項
これらの情報および投稿は、TradingViewが提供または承認する金融、投資、取引、またはその他の種類の助言もしくは推奨であることを意図したものではなく、またこれらに該当するものでもありません。詳細は利用規約をご覧ください。
免責事項
これらの情報および投稿は、TradingViewが提供または承認する金融、投資、取引、またはその他の種類の助言もしくは推奨であることを意図したものではなく、またこれらに該当するものでもありません。詳細は利用規約をご覧ください。