
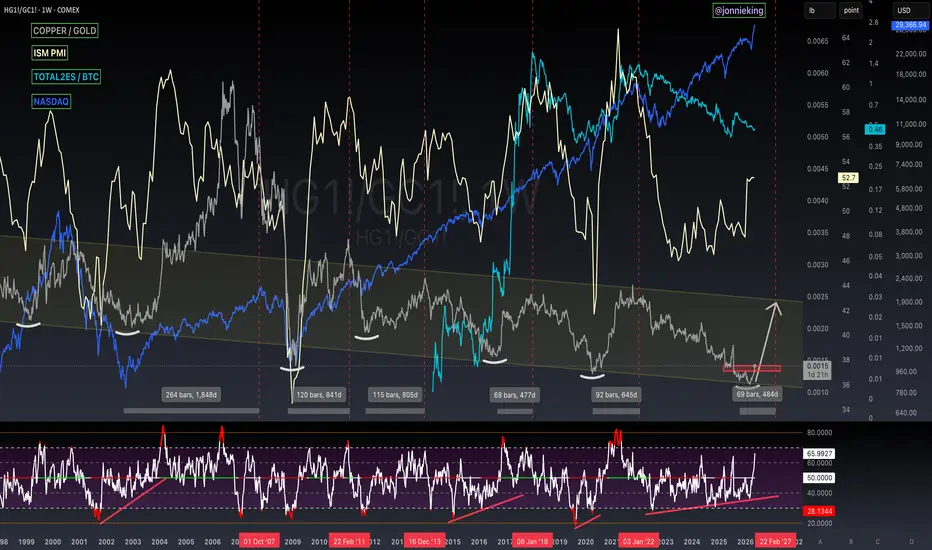
It’s been a while since I gave an update on this chart.
Looks like I called the bottom on COPPER / GOLD in Nov. ’25.
Huge breakout pending critical resistance.
“In 2016 When the ISM climbed above 50, COPPER soon found a bottom and Alts ripped.
Notice the bullish divergence on the RSI during that time, same as we are seeing now.
It looking like C/G may have found a bottom on this multi-decade parallel channel. “
Stocks have benefited very well from this, not so much crypto.
Macro is fascinating at the current moment to say the least.
Looks like I called the bottom on COPPER / GOLD in Nov. ’25.
Huge breakout pending critical resistance.
“In 2016 When the ISM climbed above 50, COPPER soon found a bottom and Alts ripped.
Notice the bullish divergence on the RSI during that time, same as we are seeing now.
It looking like C/G may have found a bottom on this multi-decade parallel channel. “
Stocks have benefited very well from this, not so much crypto.
Macro is fascinating at the current moment to say the least.

関連の投稿
免責事項
これらの情報および投稿は、TradingViewが提供または承認する金融、投資、取引、またはその他の種類の助言もしくは推奨であることを意図したものではなく、またこれらに該当するものでもありません。詳細は利用規約をご覧ください。
免責事項
これらの情報および投稿は、TradingViewが提供または承認する金融、投資、取引、またはその他の種類の助言もしくは推奨であることを意図したものではなく、またこれらに該当するものでもありません。詳細は利用規約をご覧ください。