
29-11
Daily chart of HINDPETRO1!
LTP: 238.85
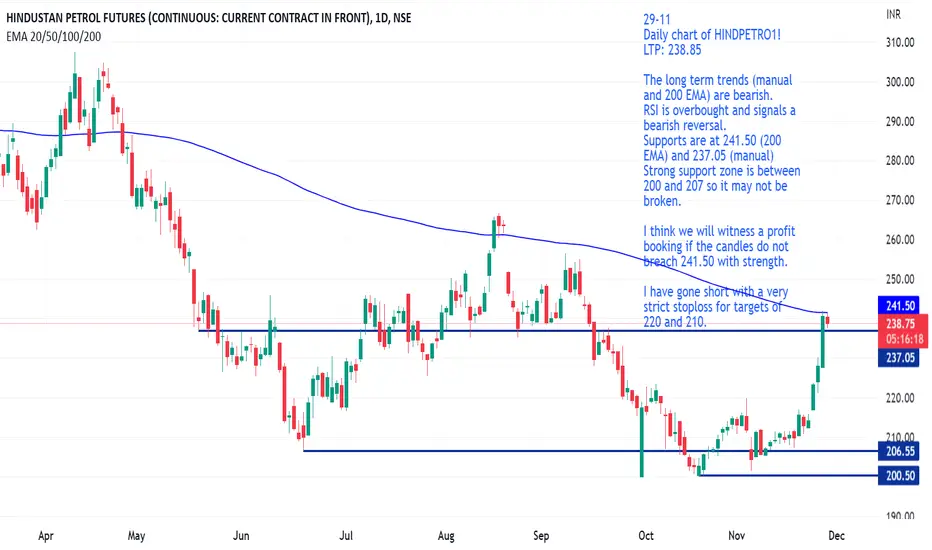
The long term trends (manual and 200 EMA) are bearish.
RSI is overbought and signals a bearish reversal.
Supports are at 241.50 (200 EMA) and 237.05 (manual)
Strong support zone is between 200 and 207 so it may not be broken.
I think we will witness a profit booking if the candles do not breach 241.50 with strength.
I have gone short with a very strict stoploss for targets of 220 and 210.
Daily chart of HINDPETRO1!
LTP: 238.85
The long term trends (manual and 200 EMA) are bearish.
RSI is overbought and signals a bearish reversal.
Supports are at 241.50 (200 EMA) and 237.05 (manual)
Strong support zone is between 200 and 207 so it may not be broken.
I think we will witness a profit booking if the candles do not breach 241.50 with strength.
I have gone short with a very strict stoploss for targets of 220 and 210.

免責事項
これらの情報および投稿は、TradingViewが提供または承認する金融、投資、取引、またはその他の種類の助言もしくは推奨であることを意図したものではなく、またこれらに該当するものでもありません。詳細は利用規約をご覧ください。
免責事項
これらの情報および投稿は、TradingViewが提供または承認する金融、投資、取引、またはその他の種類の助言もしくは推奨であることを意図したものではなく、またこれらに該当するものでもありません。詳細は利用規約をご覧ください。