
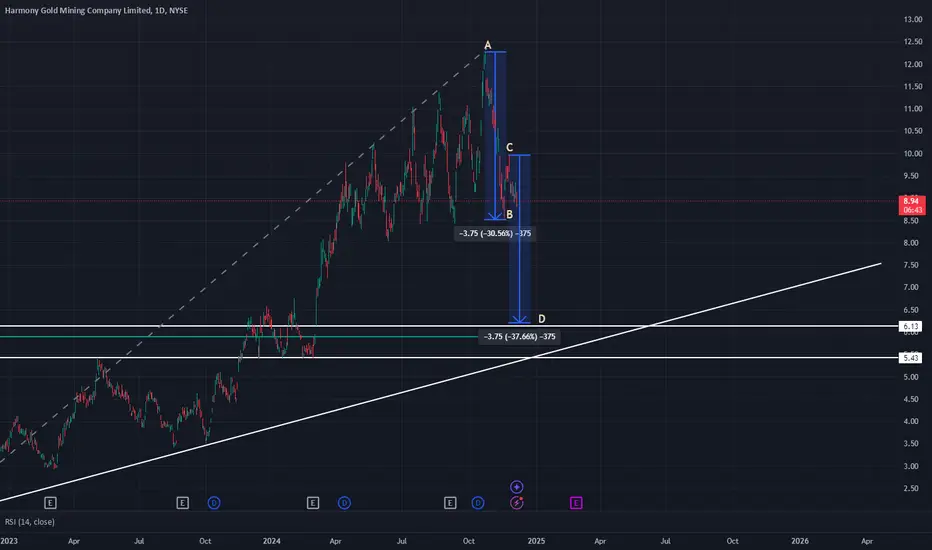
HMY is formed a falling wedge from recent highs and currently making falling wedge with ABCD pattern. This means there is one more leg downwards to go. In ABCD pattern, the size of the second move downwards is very much the same as first move (either in $ or % terms). The projected price of completion of this falling wedge with ABCD pattern is between 6.13 and 5.43 because this coincides with:
- a major support zone from Weekly timeframe at 5.90 (D)
- Fibonacci retracement level of 0.618 is at 5.90
- gap fill is also at 5.90 (D)
- a major support zone from Weekly timeframe at 5.43
Also, if we look at price range of first wedge pattern drop, it was $3.75 (from recent highs). With the formation of ABCD, the second wedge pattern price drop is also likely to be 3.75 from C point of ABCD pattern. This coincides with 6.13 price level.
- a major support zone from Weekly timeframe at 5.90 (D)
- Fibonacci retracement level of 0.618 is at 5.90
- gap fill is also at 5.90 (D)
- a major support zone from Weekly timeframe at 5.43
Also, if we look at price range of first wedge pattern drop, it was $3.75 (from recent highs). With the formation of ABCD, the second wedge pattern price drop is also likely to be 3.75 from C point of ABCD pattern. This coincides with 6.13 price level.

免責事項
これらの情報および投稿は、TradingViewが提供または承認する金融、投資、取引、またはその他の種類の助言もしくは推奨であることを意図したものではなく、またこれらに該当するものでもありません。詳細は利用規約をご覧ください。
免責事項
これらの情報および投稿は、TradingViewが提供または承認する金融、投資、取引、またはその他の種類の助言もしくは推奨であることを意図したものではなく、またこれらに該当するものでもありません。詳細は利用規約をご覧ください。