
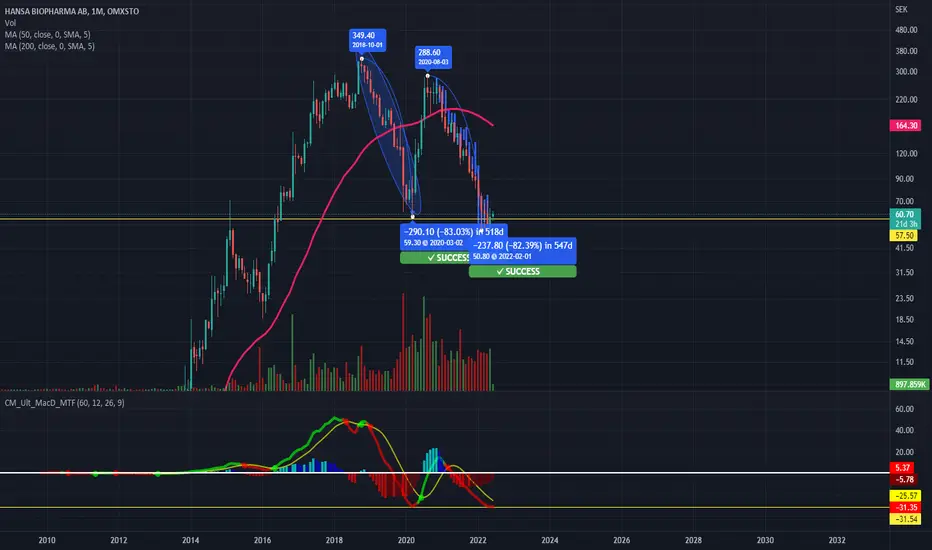
I don't know if this is a valid method but it caught my eye that the bars pattern of the last dowtrend and the downtrend before are very alike. Both with a downmove of around 83%. On the MACD it also moved up at the same level so could this mean something?
Could this be a valid theory or am I just trippin?
Not finncial advice in case this wasn't already clear :)
Could this be a valid theory or am I just trippin?
Not finncial advice in case this wasn't already clear :)

免責事項
これらの情報および投稿は、TradingViewが提供または承認する金融、投資、取引、またはその他の種類の助言もしくは推奨であることを意図したものではなく、またこれらに該当するものでもありません。詳細は利用規約をご覧ください。
免責事項
これらの情報および投稿は、TradingViewが提供または承認する金融、投資、取引、またはその他の種類の助言もしくは推奨であることを意図したものではなく、またこれらに該当するものでもありません。詳細は利用規約をご覧ください。