ロング
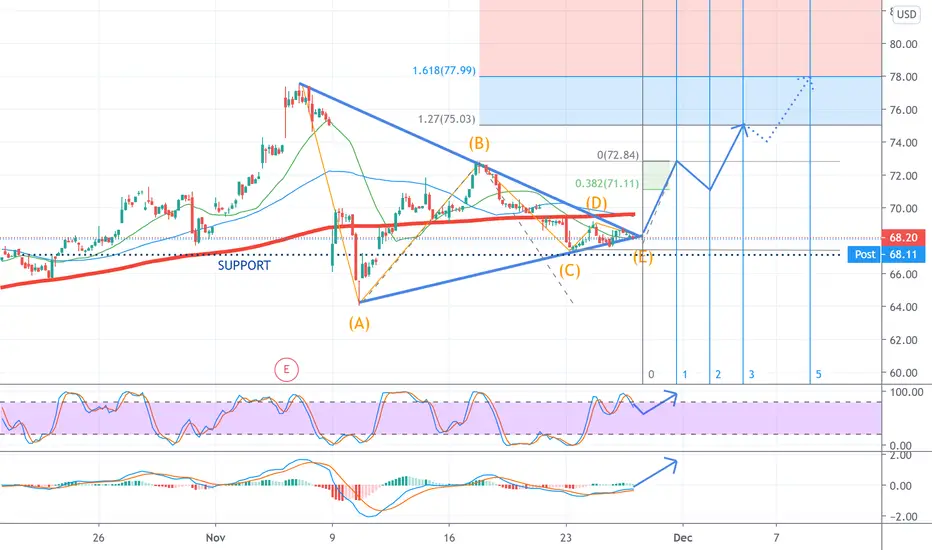
$HOLX Correction Pattern
 HOLX
Testing Correction Pattern theory: Bull Pennant with support. In theory this is ready to bounce – fib trend would suggest 1.27 is at $75.
“I’m not an expert but I have watched a lot of youtube videos.”
$NASDAQ:HOLX
ノート
Breaking the 200SMA will be key. If it resists, I think the chart will fail.ノート
Held the bottom trend line - higher lows, extended-tighter consolidation... I think that tends to mean a larger gap up. I switched to the EMA chart today instead of the SMA and it broke the 50 day EMA and road the top side of the 20 day... I think the Chart is still in play. Let's see how it goes!トレード終了: 利益確定目標に到達
This may continue to go up more but taking some profit now.
免責事項
これらの情報および投稿は、TradingViewが提供または承認する金融、投資、取引、またはその他の種類の助言もしくは推奨であることを意図したものではなく、またこれらに該当するものでもありません。詳細は利用規約をご覧ください。
免責事項
これらの情報および投稿は、TradingViewが提供または承認する金融、投資、取引、またはその他の種類の助言もしくは推奨であることを意図したものではなく、またこれらに該当するものでもありません。詳細は利用規約をご覧ください。