
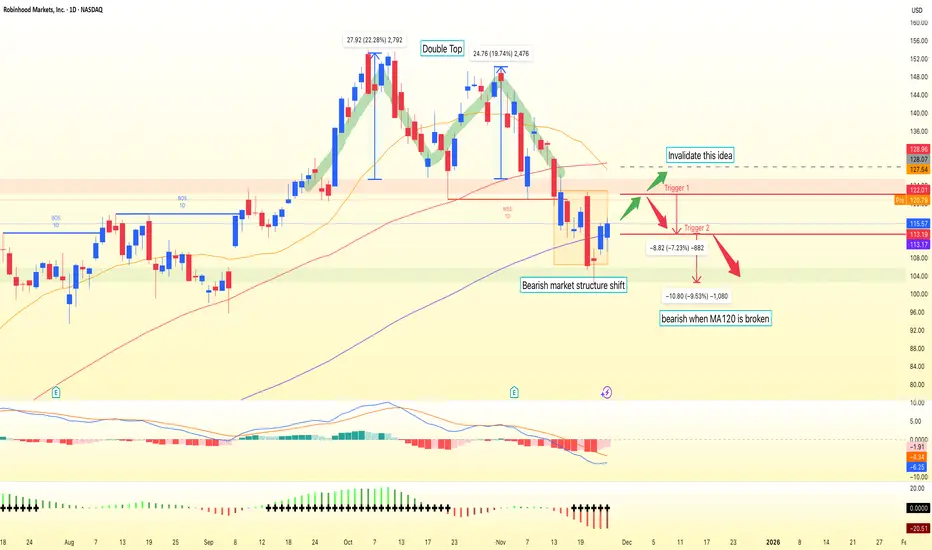
HOOD on the daily chart has completed a clear bearish Market Structure Shift after its October peak. Price is now trading below the 20-day and 60-day moving averages (around 127.54 and 128.96), confirming short- to mid-term downside momentum, while resting on long-term support near the 120-day MA around 113.17. We’ve already seen price bounce off this zone, and with premarket now around 121, the earlier “bounce long” idea is effectively behind us.
From here, the primary plan is to fade strength into the former support turned resistance around 122.50. If price pushes into that zone and fails—confirmed by a bearish daily candle or a close back below 121.00—the short bias is favored. The first downside objective is a retest of the 110.00–113.00 area around the 120-day MA and recent lows. A clean break below 104.00 would open the door to a deeper move toward the psychological 100.00 level. Invalidation for the bearish view sits above 128.00, where a daily close would reclaim the 20- and 60-day MAs and negate the idea of simple rally-fades. This is a study, not financial advice. Manage risk and invalidations.
Thought of the Day 💡
Good trade ideas are built around “if–then” conditions, not predictions. Define the path, then wait for price to prove it.
--------------------------
Thanks for your support!
If you found this idea helpful or learned something new, drop a like 👍 and leave a comment, I’d love to hear your thoughts

follow my X 👉 x.com/bbqgio
🔥 level up your Stock, FX, & Crypto: VIP access to AI technical analysis and pro market insights at TradeOS + 50%-off promo code ONBOARD 👉
ai.tradeos.xyz/?utm_source=tvbg
🔥 level up your Stock, FX, & Crypto: VIP access to AI technical analysis and pro market insights at TradeOS + 50%-off promo code ONBOARD 👉
ai.tradeos.xyz/?utm_source=tvbg
関連の投稿
免責事項
これらの情報および投稿は、TradingViewが提供または承認する金融、投資、取引、またはその他の種類の助言もしくは推奨であることを意図したものではなく、またこれらに該当するものでもありません。詳細は利用規約をご覧ください。