
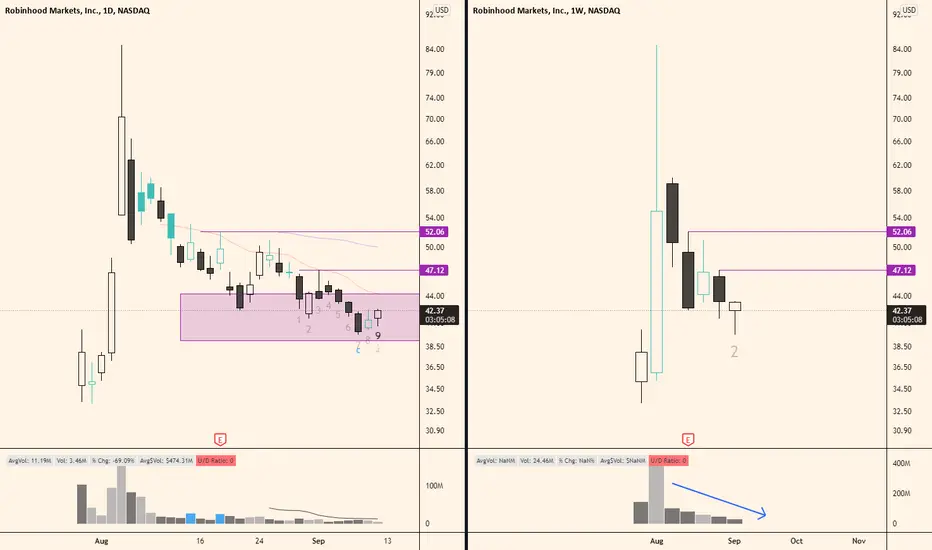
Robinhood made its first daily 9. Weekly chart might print the first bull candle week since the pullback. If daily doesn't form a good base next week we might be looking at either 13 combo or sequential.
An explosion on the daily volume bar over 20 day average could signify a bottoming entry.
An explosion on the daily volume bar over 20 day average could signify a bottoming entry.

Kidze
免責事項
これらの情報および投稿は、TradingViewが提供または承認する金融、投資、取引、またはその他の種類の助言もしくは推奨であることを意図したものではなく、またこれらに該当するものでもありません。詳細は利用規約をご覧ください。
Kidze
免責事項
これらの情報および投稿は、TradingViewが提供または承認する金融、投資、取引、またはその他の種類の助言もしくは推奨であることを意図したものではなく、またこれらに該当するものでもありません。詳細は利用規約をご覧ください。