更新済
HOTUSD: Decision Time - The Countdown Phase
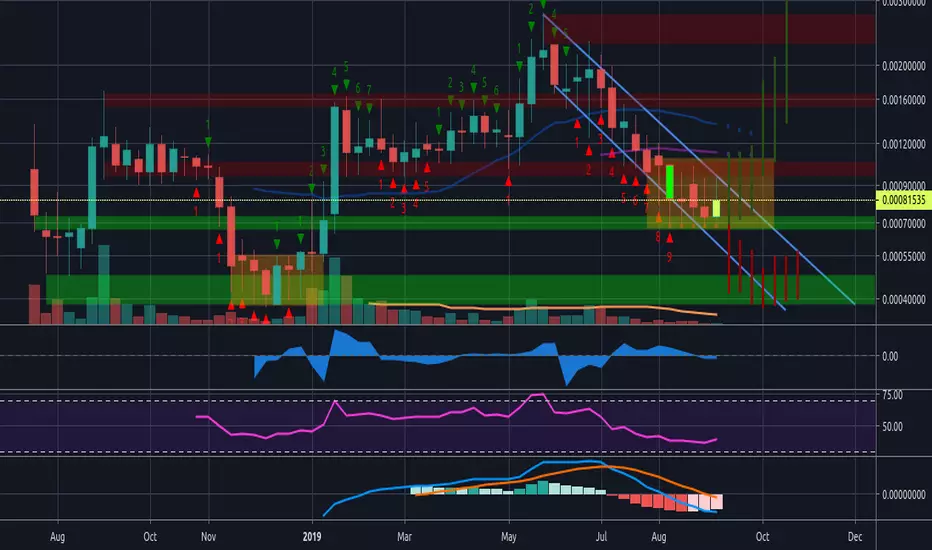
- TD Sequential support from the red 9 is at $0.00068195 (red dots), at bottom of horizontal support area.
- If sequential/horizontal support is broken to the downside, expect a breach of the falling channel to the next support.
- Waiting to see what happens in the countdown phase, whether the sequential will flip green soon or carry on red.
- There's a similarity in the November-December 2018 consolidation (in organge) but far from convincing.
- The projected bars are taken from the most substantial rises (January 2019) and crashes (November 2018).
- This is the first time the Weekly TD Sequential has reached a 9 or 13 for the HOTUSD pairing.
- Indicators all look bearish on a weekly scale and don't look much better on the Daily either.
- Upside target: $0.0037 (+360% NATH) / Downside target: $0.000385 (-53%).
- FYI-ATL: $0.000341 on June 29th 2018, not December 2018 low.
ノート
HOT is testing the falling channel resistance, flirting again with green price flip on the weekly. The Daily is testing the 50 Day MA that it has seen since early July. Looking bullish for now but too early to tell.ノート
Looks obvious which way this is going then, back down to support after getting rejected by channel resistance.ノート
Currently testing channel resistance.
関連の投稿
免責事項
これらの情報および投稿は、TradingViewが提供または承認する金融、投資、取引、またはその他の種類の助言もしくは推奨であることを意図したものではなく、またこれらに該当するものでもありません。詳細は利用規約をご覧ください。
免責事項
これらの情報および投稿は、TradingViewが提供または承認する金融、投資、取引、またはその他の種類の助言もしくは推奨であることを意図したものではなく、またこれらに該当するものでもありません。詳細は利用規約をご覧ください。