
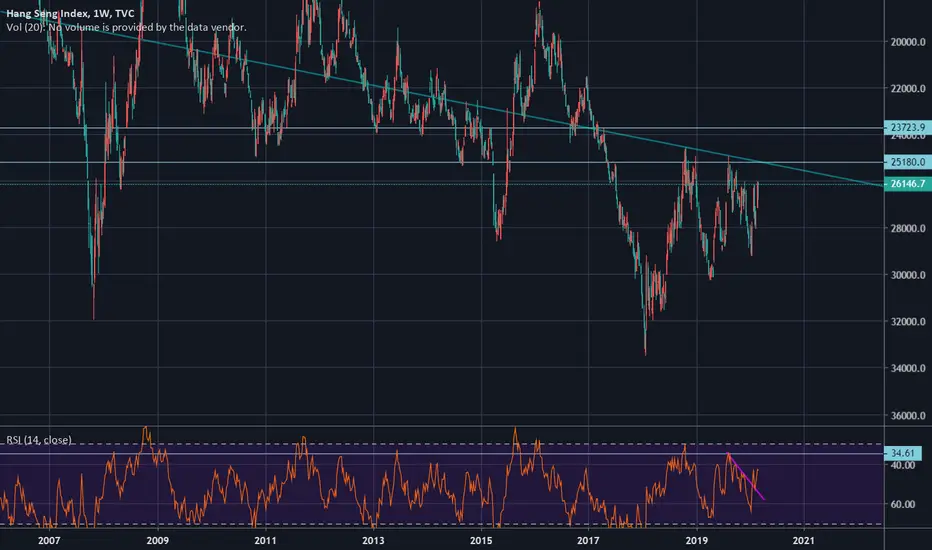
While everyone is trying catch a bottom, the HSI Inverted Weekly Chart gives a bearish view on the Hang Seng Index.
The candles from the last three weeks are bearish:
1) A Reversal Red Candle
2) A Gap with Solid Long Red Candle
3) Green Candle with Long Wick
In the coming two weeks it may hit and test the weekly support line at around 25180.
Let's see how the market reacts to the support level.
If selling is strong, it may break below 24000.

免責事項
これらの情報および投稿は、TradingViewが提供または承認する金融、投資、取引、またはその他の種類の助言もしくは推奨であることを意図したものではなく、またこれらに該当するものでもありません。詳細は利用規約をご覧ください。
免責事項
これらの情報および投稿は、TradingViewが提供または承認する金融、投資、取引、またはその他の種類の助言もしくは推奨であることを意図したものではなく、またこれらに該当するものでもありません。詳細は利用規約をご覧ください。