
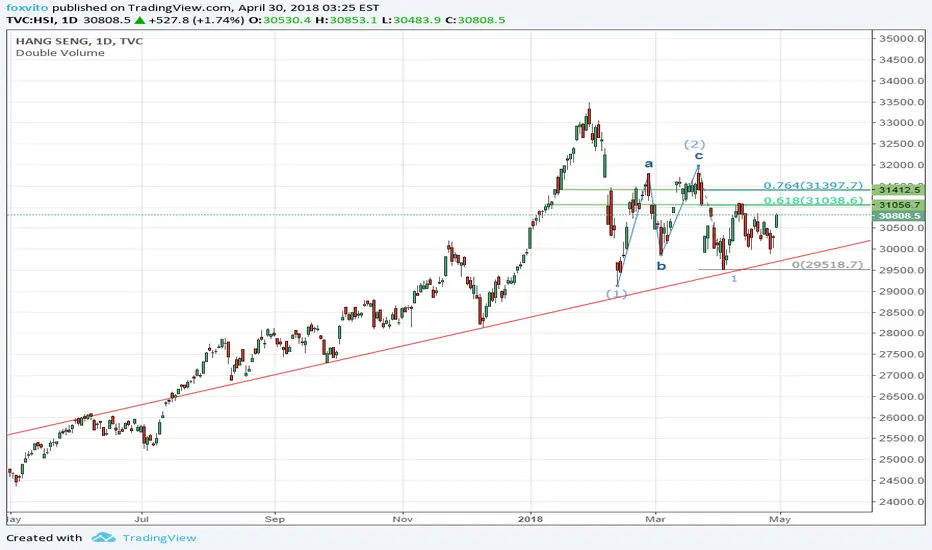
As stated in the diagram. HSI might go downward as the fibonacci ratio match. The target of the wave may be 26000.
If we see any strong resistance at 31000 or 31400 in this week. It is very likely that HSI will follow this trend to move
If we see any strong resistance at 31000 or 31400 in this week. It is very likely that HSI will follow this trend to move
手動でトレードを終了しました
Unfortunately, HSI cannot stand on 0.764 (around 31400). See it immediately drop under it the next day.As now the RSI is very low and comes to a critical support line. I close the position first. Wait and see if it is a rebound or a new raising wave.
トレード終了: ストップロスに到達

免責事項
これらの情報および投稿は、TradingViewが提供または承認する金融、投資、取引、またはその他の種類の助言もしくは推奨であることを意図したものではなく、またこれらに該当するものでもありません。詳細は利用規約をご覧ください。
免責事項
これらの情報および投稿は、TradingViewが提供または承認する金融、投資、取引、またはその他の種類の助言もしくは推奨であることを意図したものではなく、またこれらに該当するものでもありません。詳細は利用規約をご覧ください。