
For personal interests, analyses on the HSI will be initiated...
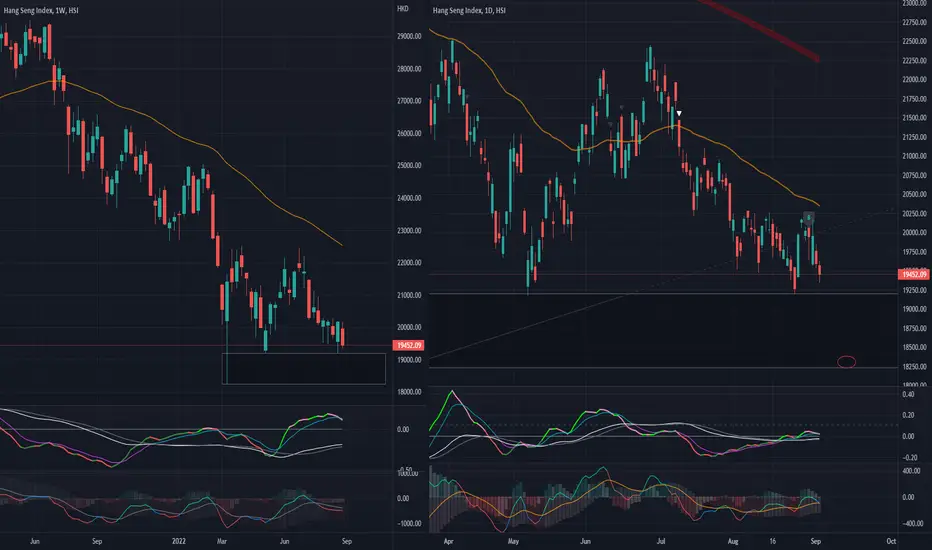
The weekly chart closed on a bearish note, at a 5 year low. Close to a suuport at 19,200, if it breaks down -250 points, there would be more downside to the last low of March 2022, at 18,235.
As with many of the analyses done this weekend, a lot of indications that the last low will be revistied.
The daily chart has a breakdown over he last week, and daily technicals are crossing under. These are indicative of more downward momentum.
Overall, bearish aura prevails for the Hang Seng Index.
The weekly chart closed on a bearish note, at a 5 year low. Close to a suuport at 19,200, if it breaks down -250 points, there would be more downside to the last low of March 2022, at 18,235.
As with many of the analyses done this weekend, a lot of indications that the last low will be revistied.
The daily chart has a breakdown over he last week, and daily technicals are crossing under. These are indicative of more downward momentum.
Overall, bearish aura prevails for the Hang Seng Index.

免責事項
これらの情報および投稿は、TradingViewが提供または承認する金融、投資、取引、またはその他の種類の助言もしくは推奨であることを意図したものではなく、またこれらに該当するものでもありません。詳細は利用規約をご覧ください。
免責事項
これらの情報および投稿は、TradingViewが提供または承認する金融、投資、取引、またはその他の種類の助言もしくは推奨であることを意図したものではなく、またこれらに該当するものでもありません。詳細は利用規約をご覧ください。