
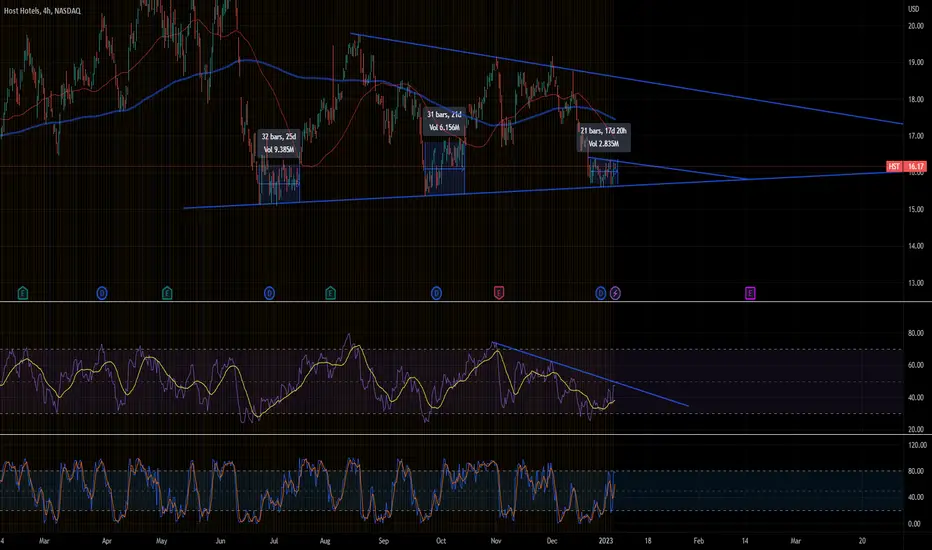
As we can see here HST has been moving in a huge symmetrical triangle as we can see here the stock consolidates for about 2 weeks and a half once touching down at support before breaking out to the upside to once again touch the resistance.
Things to NOTE:
1. Bullish Divergence on the RSI
2. Inverse H & S Here
3.Bullish PIN BAR on the WEEKLY time frame
These are very strong indicators that HST may see a move up on the upcoming weeks. Play it as you will, I'd love to hear your input on this or exchange ideas on other possible stock moves. Happy trading fellas :" }
Things to NOTE:
1. Bullish Divergence on the RSI
2. Inverse H & S Here
3.Bullish PIN BAR on the WEEKLY time frame
These are very strong indicators that HST may see a move up on the upcoming weeks. Play it as you will, I'd love to hear your input on this or exchange ideas on other possible stock moves. Happy trading fellas :" }

免責事項
これらの情報および投稿は、TradingViewが提供または承認する金融、投資、取引、またはその他の種類の助言もしくは推奨であることを意図したものではなく、またこれらに該当するものでもありません。詳細は利用規約をご覧ください。
免責事項
これらの情報および投稿は、TradingViewが提供または承認する金融、投資、取引、またはその他の種類の助言もしくは推奨であることを意図したものではなく、またこれらに該当するものでもありません。詳細は利用規約をご覧ください。