
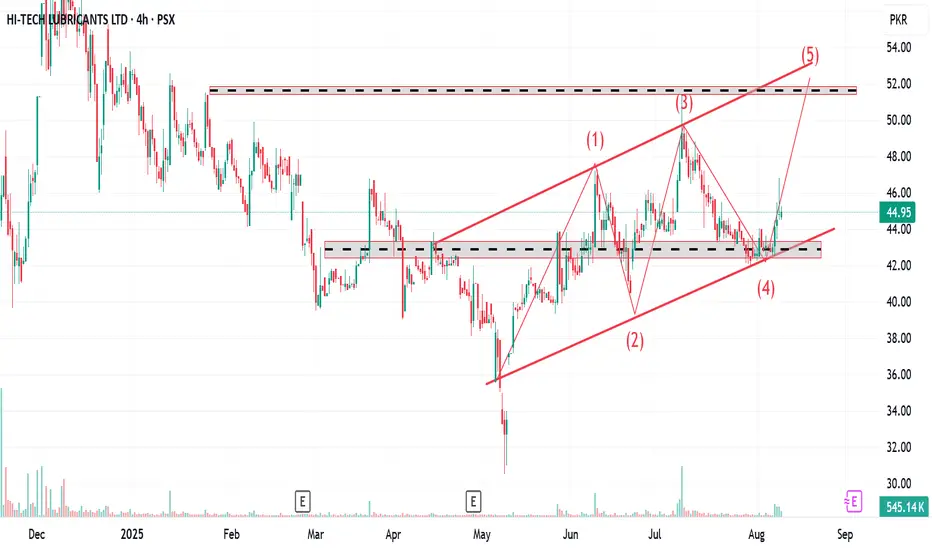
An uptrend channel is a chart pattern where price moves between two parallel, upward-sloping trendlines. The lower line (support) connects higher lows, while the upper line (resistance) connects higher highs.Key Points:
Support: The lower trendline, where price tends to bounce.
Resistance: The upper trendline, where price tends to face selling pressure.
Price Action: Price moves within these lines, forming higher highs and higher lows.
Trading:
Buy near support (lower trendline).
Sell near resistance (upper trendline).
A breakout above resistance or a breakdown below support signals trend continuation or reversal.
It's a bullish pattern indicating sustained upward movement.
Support: The lower trendline, where price tends to bounce.
Resistance: The upper trendline, where price tends to face selling pressure.
Price Action: Price moves within these lines, forming higher highs and higher lows.
Trading:
Buy near support (lower trendline).
Sell near resistance (upper trendline).
A breakout above resistance or a breakdown below support signals trend continuation or reversal.
It's a bullish pattern indicating sustained upward movement.

免責事項
これらの情報および投稿は、TradingViewが提供または承認する金融、投資、取引、またはその他の種類の助言もしくは推奨であることを意図したものではなく、またこれらに該当するものでもありません。詳細は利用規約をご覧ください。
免責事項
これらの情報および投稿は、TradingViewが提供または承認する金融、投資、取引、またはその他の種類の助言もしくは推奨であることを意図したものではなく、またこれらに該当するものでもありません。詳細は利用規約をご覧ください。