HTUSDT
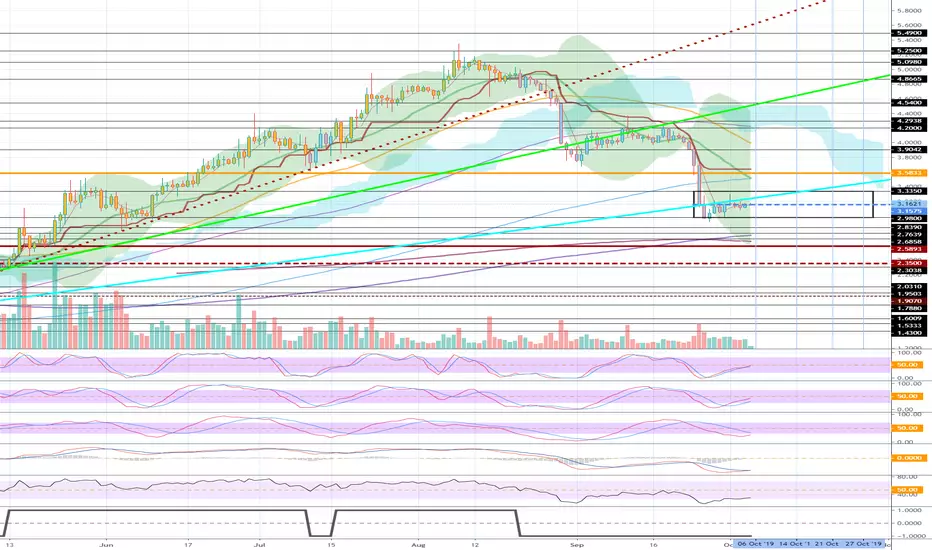
The sky blue uptrend line we drew on the previous chart is wrong.
HT is a bit off the light blue trend line, and I think it's a good position to keep the price.
The inflection date of the BTC chart is indicated.
We will see how the price of HT changes accordingly.
If you slowly climb along the upward trend line and reach 3.5833, you will see a full-fledged rise.
HT is a bit off the light blue trend line, and I think it's a good position to keep the price.
The inflection date of the BTC chart is indicated.
We will see how the price of HT changes accordingly.
If you slowly climb along the upward trend line and reach 3.5833, you will see a full-fledged rise.

[Practical trading strategy using HA-MS and SBOD]
youtu.be/aceN1AttX1Y
youtu.be/aceN1AttX1Y
免責事項
これらの情報および投稿は、TradingViewが提供または承認する金融、投資、取引、またはその他の種類の助言もしくは推奨であることを意図したものではなく、またこれらに該当するものでもありません。詳細は利用規約をご覧ください。
[Practical trading strategy using HA-MS and SBOD]
youtu.be/aceN1AttX1Y
youtu.be/aceN1AttX1Y
免責事項
これらの情報および投稿は、TradingViewが提供または承認する金融、投資、取引、またはその他の種類の助言もしくは推奨であることを意図したものではなく、またこれらに該当するものでもありません。詳細は利用規約をご覧ください。