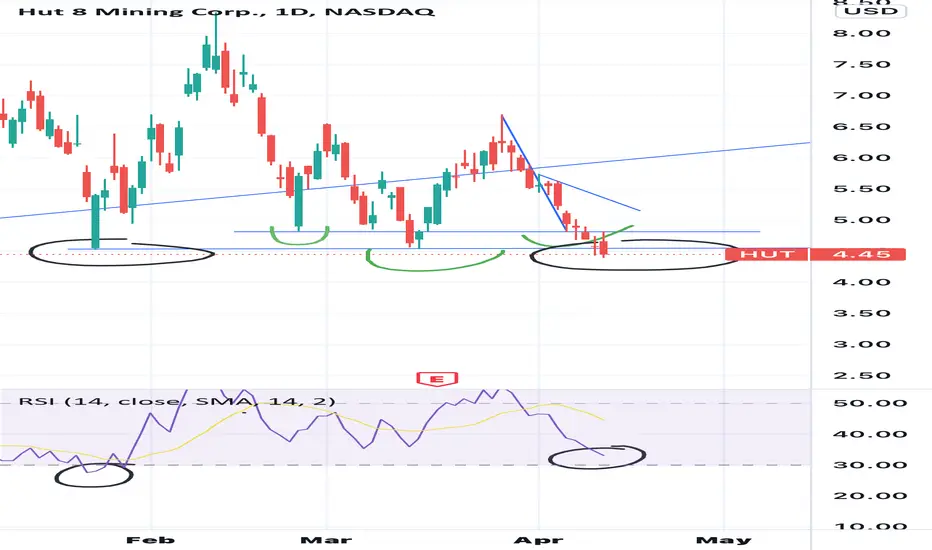
HUT broke down from the inverse head and shoulders. It even has candle confirmation - spinning doji followed by bearish engulfing. It is fair to say that the IHS is NEGATED.
I see 2 bullish scenarios here on HUT . In this order:
1. Bullish divergence on $HUT. It can bounce righy here on the 4.50 support and see much higher levels: 4.8, 5, 5.5 and even higher levels.
2.HUT loses the bearish divergence and goes for oversold zone (below 30 RSI and under). It can try to bounce here.
Thanks for reading. What do you think?
This is not financial advice. This is solely for entertainment purposes. Do not take anything from this idea as advice in any way, shape, or form.
I see 2 bullish scenarios here on
HUT . In this order: 1. Bullish divergence on $HUT. It can bounce righy here on the 4.50 support and see much higher levels: 4.8, 5, 5.5 and even higher levels.
2.
HUT loses the bearish divergence and goes for oversold zone (below 30 RSI and under). It can try to bounce here.Thanks for reading. What do you think?
This is not financial advice. This is solely for entertainment purposes. Do not take anything from this idea as advice in any way, shape, or form.

関連の投稿
免責事項
これらの情報および投稿は、TradingViewが提供または承認する金融、投資、取引、またはその他の種類の助言もしくは推奨であることを意図したものではなく、またこれらに該当するものでもありません。詳細は利用規約をご覧ください。
免責事項
これらの情報および投稿は、TradingViewが提供または承認する金融、投資、取引、またはその他の種類の助言もしくは推奨であることを意図したものではなく、またこれらに該当するものでもありません。詳細は利用規約をご覧ください。